
Figure S1
- ID
- ZDB-FIG-191230-895
- Publication
- Baron et al., 2019 - Cell Type Purification by Single-Cell Transcriptome-Trained Sorting
- Other Figures
- All Figure Page
- Back to All Figure Page
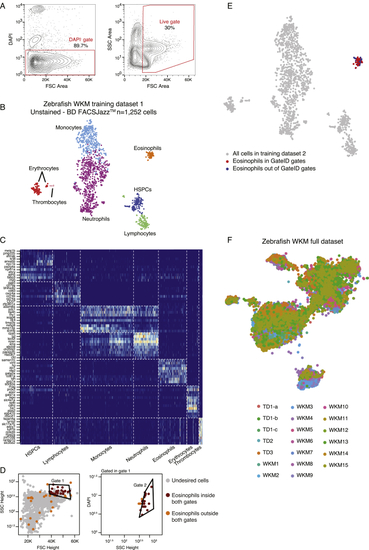
Generation of the Zebrafish WKM Unstained TD, Related to (A) Contour plots of sorted live WKM cells to generate WKM TD1. The left panel show the DAPI- gate used to select live cells and the right panel shows the gate used to exclude erythrocytes that are low in FSC Height space. (B) t-SNE map of zebrafish WKM TD1 generated on BD FACSJazz. Single cells are colored based on cell type. (C) Heatmap showing marker genes for all hematopoietic cell types identified in the WKM full dataset. (D) GateID predicted gates to isolate eosinophils from unstained WKM TD1. Grey points are undesired cells in TD1. Orange points are eosinophils outside both GateID predicted gates (excluded by GateID). Red points are eosinophils inside both GateID predicted gates (sorted by GateID). (E) t-SNE map of zebrafish WKM TD1 where eosinophils inside and outside of GateID gates are colored in red and blue respectively. (F) t-SNE map of experimental contributions to the zebrafish WKM full dataset. Single cells are colored based on experiment number. |
Reprinted from Cell, 179, Baron, C.S., Barve, A., Muraro, M.J., van der Linden, R., Dharmadhikari, G., Lyubimova, A., de Koning, E.J.P., van Oudenaarden, A., Cell Type Purification by Single-Cell Transcriptome-Trained Sorting, 527-542.e19, Copyright (2019) with permission from Elsevier. Full text @ Cell