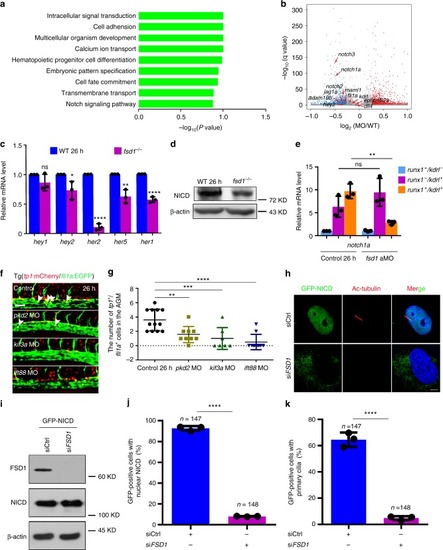
Notch signaling is downregulated in hemogenic endothelium (HE) cells in primary cilia-impaired embryos. a The gene ontology analysis for the downregulated genes in fsd1 morphants. b Volcano plot showing the dysregulated genes between wild-type embryos and fsd1 morphants at 26 hpf. Endothelial cell markers kdrl and fli1a, arterial markers including ephrinB2a, dll4, and hey2, and Notch signaling components including notch1a, notch2, notch3, maml1, jag1a, and adam10b are highlighted in black. Red arrows denote the gene location site. c qPCR result of Notch target genes in wild-type embryos and fsd1 mutants at 26 hpf. Error bars, mean ± s.d., * P < 0.05, **P < 0.01, ****P < 0.0001, ns non-significant, Student’s t-test. n = 3 biological replicates. d Western blotting showing the protein level of NICD in wild-type embryos and fsd1−/− at 26 hpf. e Expression of notch1a in kdrl+runx1+ cells in the AGM in control and fsd1 morphants at 26 hpf. Error bars, mean ± s.d., **P < 0.01, ns non-significant, Student’s t-test. n = 3 biological replicates. f, g Confocal imaging of Tg (tp1:mCherry/fli1a:EGFP) embryos in the AGM region in control and cilia-impaired embryos at 26 hpf. tp1:mCherry+/fli1a:EGFP+ double positive cells (white arrowheads) were quantified in g. Scale bar, 50 µm. Data represent the analysis results of one-way ANOVA–Dunnett test. Error bars, mean ± s.d., n = 12, 9, 7, 10 embryos, **P < 0.01,***P < 0.001, ****P < 0.0001. h Immunofluorescence staining of RPE-1 cells with acetylated α-tubulin (Ac-tubulin, cilia marker) antibodies and Hoechst (DNA marker) in ciliated and non-ciliated cells treated with siCtrl and siFSD1 respectively. RPE-1 cells were transfected with GFP-NICD plasmid and indicated siRNA. The nuclei were stained with Hoechst (blue) and the cilium was marked by Ac-tubulin (red). The GFP indicated the NICD expression. Scale bar, 5 µm. i Western blotting showing the protein levels of NICD, β-actin and FSD1 in GFP-NICD plasmid transfected in siCtrl or siFSD1 RPE-1 cells. j, k Quantification of GFP-positive cells with nuclear NICD (j) or with primary cilia (k) in h. Data are presented with three independent experiments. Error bars, mean ± s.d., ****P < 0.0001. Student’s t-test. n number of cells
|
