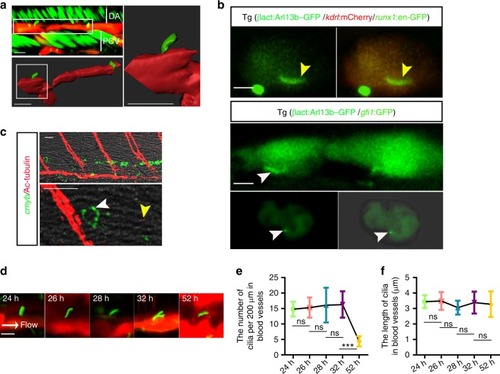
Ciliogenesis occurs in vascular endothelial cells (ECs) in AGM. a Three-dimension (3D) confocal imaging showing cilia on ECs in the AGM region using Tg(βact:Arl13b–GFP/kdrl:mCherry/runx1:en-GFP) line at 28 hpf. White squares indicate the ECs with cilia. White bars denote DA or PCV region. DA dorsal aorta, PCV posterior cardinal vein. Scale bars, 10 µm. b The live confocal imaging of kdrl+/runx1+ or gfi1+ HE cells in Tg(βact:Arl13b–GFP/kdrl:mCherry/runx1:en-GFP) (upper panel) or Tg(βact:Arl13b–GFP/gfi1:GFP) at 28 hpf (middle panel). The imaging of gfi1+ HE cells sorted by fluorescence-activated cell sorting of dissected trunk region in Tg (gfi1:GFP/βact:Arl13b–GFP) embryos (lower panel). Yellow arrowheads indicate primary cilia in kdrl+/runx1+ cells; white arrowheads indicate primary cilia in gfi1+ HE cells. Scale bars, 5 µm. c Fluorescence in situ hybridization (FISH) result showing the cmyb expression and Ac-tubulin staining showing the cilia in the aorta-gonad-mesonephros (AGM) region at 48 hpf. Yellow arrowhead indicates primary cilia and the white arrowhead indicates the cmyb+ HSPC in the AGM region. The cmyb probe was used to examine cmyb expression in Tg (cmyb:EGFP) embryos by FISH. Scale bars, 20 µm. d The live confocal imaging of cilia with kdrl:mCherry/βact:Arl13b–GFP double-transgenic line. White arrow denotes the blood flow direction. Scale bar, 5 µm. e, f The statistical data shows the primary cilia number (e) and length (f) in blood vessels in the AGM region in wild-type embryos. The cilia length presented in each embryo was the average length of all the cilia in the DA of the AGM region calculated per 200 µm. Data represent the analysis results of one-way ANOVA–Sidak test. Error bars, mean ± s.d., n = 10 embryos. ns non-significant, ***P < 0.001
|
