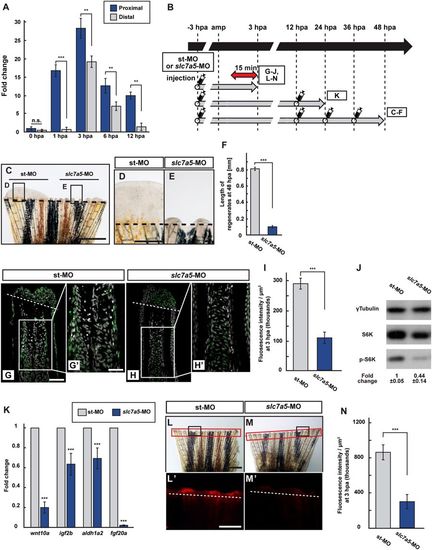
Slc7a5 is required for S6K activation and lysosomal acidification. (A) The relative expression of slc7a5 in proximal and distal fin regenerates at 0, 1, 3, 6, and 12 hpa by qPCR analyses. (B) Scheme of vivo-MO mediated knockdown experiments from −3 to 48 hpa. A red two-headed-arrow indicates LysoTracker treatment, which was applied 15 min before observation. Syringes indicate vivo-MO injection. (C–F) Outgrowth of fin regenerates and quantification of their length after being injected with standard vivo-MO (st-MO) or slc7a5 vivo-MO (slc7a5-MO) at 48 hpa (n = 5). The boxed areas in (C) are enlarged in (D and E), respectively. Representative images (C–E) used for quantification are shown in (F). Black dashed lines indicate the amputation planes. Scale bars: 1 mm (C) and 250 μm (D,E). ***p < 0.001 by Student’s t test. Error bars represent the standard error. (G–I) Longitudinal ray sections and quantification of p-S6K fluorescence intensities per area that consist of the whole regenerates and 500 μm below the amputation plane in st-MO or slc7a5-MO injected fin stumps at 3 hpa; p-S6K and nuclei were visualized by immunohistochemical staining and DAPI staining, respectively (n = 8). Representative images (G–H’) used for quantification are shown in (I). Scale bars: 50 μm (G and H) and 25 μm (G’–H’). ***p < 0.001 by Student’s t test. Error bars represent the standard error. (J) Western blotting analysis of γTubulin, S6K, and p-S6K in st-MO or slc7a5-MO injected fin stumps at 3 hpa (n = 5). γTubulin serves as a loading control. Numbers below each lane show the level of p-S6K in st-MO injected fin stumps relative to that in slc7a5-MO injected fin stumps at 3 hpa normalized to loading control. (K) The relative expression of growth factor-related genes in st-MO- or slc7a5-MO-injected fins by qPCR at 24 hpa. ***p < 0.001. Error bars represent the standard error. (L–N) Images of bright-field and fluorescence microscopy, and quantification of LysoTracker fluorescence intensities in st-MO- or slc7a5-MO-injected fin stumps at 3 hpa (n = 5). Black boxed areas in L and M are enlarged in L’ and M’, respectively. The LysoTracker fluorescence intensities in red boxed areas were measured (L–M’). Representative images (L’–M’) used for quantification are shown in (N). Scale bars: 1 mm (L and M) and 500 μm (L’ and M’). ***p < 0.001. Error bars represent the standard error.
|
