
Fig. S2
- ID
- ZDB-FIG-180803-19
- Publication
- Takayama et al., 2018 - Leucine/glutamine and v-ATPase/lysosomal acidification via mTORC1 activation are required for position-dependent regeneration
- Other Figures
- All Figure Page
- Back to All Figure Page
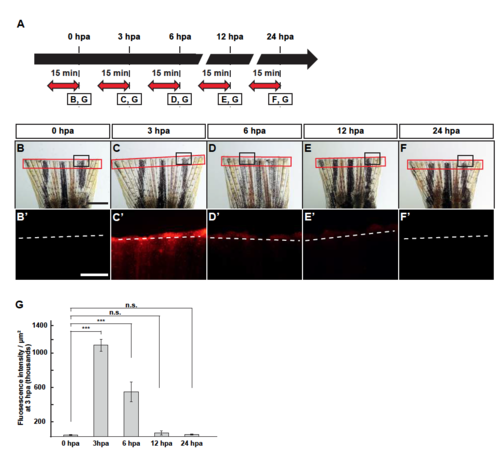
Lysosomal acidification during fin regeneration. (A) Experimental scheme. Red two-headed-arrows indicate LysoTracker treatment, which was applied 15 min before observation. (B-F’) Images of bright-field and fluorescence microscopy, and quantification of LysoTracker fluorescence intensities at 0, 3, 6, 12, and 24 hpa (n = 5). Black boxed areas in B-F are enlarged in B’-F’, respectively. The LysoTracker fluorescence intensities in red boxed areas were measured (B-F’). Representative images (B’-F’) used for quantification are shown in G. White dashed lines indicate the amputation planes. Scale bars: 1 mm (B-F) and 500µm (B’-F’). n.s.: not significant. ***p < 0.001 by Student’s t test. Error bars represent the standard error. |