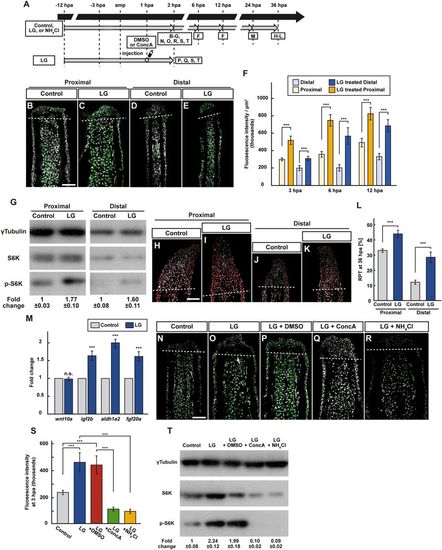
Leucine and glutamine treatment activates mTORC1 signaling via v-ATPase activity and lysosomal acidification. (A) Experimental scheme. (B–F) Longitudinal ray sections (3 hpa) and quantification of p-S6K fluorescence intensities per area that consist of the whole regenerates and 500 μm below the amputation plane (3, 6, and 12 hpa) of proximal and distal positions in control or LG-treated fin regenerates; p-S6K and nuclei were visualized by immunohistochemical staining and DAPI staining, respectively (n = 6). Representative images (B–E) used for quantification are shown in (F). White dashed lines indicate the amputation planes. Scale bars: 50 μm. ***p < 0.001 by Student’s t test. Error bars represent the standard error. (G) Western blotting analysis of γTubulin, S6K, and p-S6K in proximally and distally amputated LG-treated fin stumps at 3 hpa. γTubulin serves as a loading control. Numbers below each lane show the level of p-S6K in proximally or distally amputated LG-treated fin stumps relative to that in proximally or distally amputated control fin stumps at 3 hpa normalized to loading control, respectively. (H–L) Longitudinal ray sections and RPT quantification in proximally and distally amputated control or LG-treated fin regenerates at 36 hpa; PCNA and nuclei were visualized by immunohistochemical staining and DAPI staining, respectively (n = 5). Representative images (H–K) used for quantification are shown in (L). White dashed lines indicate the amputation planes. Scale bars: 50 μm. ***p < 0.001 by Student’s t test. Error bars represent the standard error. (M) The relative expression of growth factor-related genes in control and LG-treated fin regenerates by qPCR at 24 hpa. n.s.: not significant. ***p < 0.001 by Student’s t test. Error bars represent the standard error. (N–S) Longitudinal ray sections and quantification of p-S6K fluorescence intensities per area that consist of the whole regenerates and 500 μm below the amputation plane in control, LG-treated, LG-treated and DMSO-injected (LG + DMSO), LG-treated and ConcA-injected (LG + ConcA), or LG- and NH4Cl-treated (LG + NH4Cl) fin stumps at 3 hpa; p-S6K and nuclei were visualized by immunohistochemical staining and DAPI staining, respectively (n = 5). Representative images (N–R) used for quantification are shown in (S). White dashed lines indicate the amputation planes. Scale bars: 50 μm. ***p < 0.001 by Student’s t test. Error bars represent the standard error. (T) Western blotting analysis of γTubulin, S6K, and p-S6K in control, LG-treated, LG + DMSO, LG + ConcA, or LG + NH4Cl fin stumps at 3 hpa (n = 6). γTubulin serves as a loading control. Numbers below each lane show the level of p-S6K in LG-treated, LG + DMSO, LG + ConcA, or LG + NH4Cl fin stumps relative to that in control fin stumps at 3 hpa normalized to loading control.
|
