
Fig. 5
- ID
- ZDB-FIG-180803-16
- Publication
- Takayama et al., 2018 - Leucine/glutamine and v-ATPase/lysosomal acidification via mTORC1 activation are required for position-dependent regeneration
- Other Figures
- All Figure Page
- Back to All Figure Page
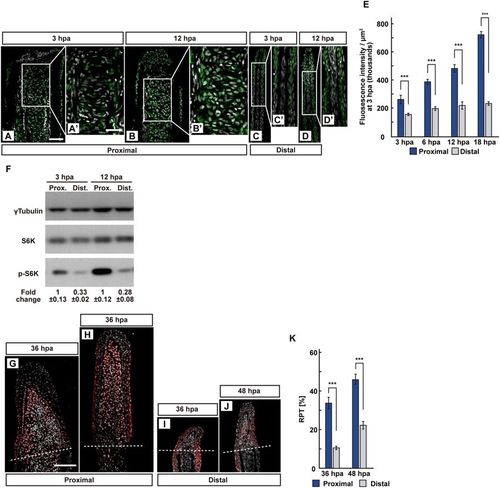
The position-dependent activation of S6K during fin regeneration. (A–E) Longitudinal ray sections (3 and 12 hpa) and quantification of p-S6K fluorescence intensities per area that consist of the whole regenerates and 500 μm below the amputation plane (3, 6, 12, and 18 hpa) of proximal and distal positions in WT fins; p-S6K and nuclei were visualized by immunohistochemical staining and DAPI staining, respectively (n = 8). Representative images (A–D’) used for quantification are shown in (E). White dashed lines indicate the amputation planes. Scale bars: 50 μm (A–D) and 25 μm (A’–D’). ***p < 0.001 by Student’s t test. Error bars represent the standard error. (F) Western blotting analysis of γTubulin, S6K, and p-S6K in WT fin stumps at 3 and 12 hpa. γTubulin serves as a loading control. Numbers below each lane show the level of p-S6K in proximal fin stumps relative to that in distal fin stumps at 3 or 12 hpa normalized to loading control, respectively. (G–J) Longitudinal ray sections of proximal and distal fins in WT fins at 36 and 48 hpa; PCNA and nuclei were visualized by immunohistochemical staining and DAPI staining, respectively (n = 5). Representative images (G–J) used for quantification are shown in (K). White dashed lines indicate the amputation planes. Scale bars: 50 μm (G–J). (K) Ratios of PCNA-positive cell number/total cell number (RPTs) in whole regenerates at 36 and 48 hpa (n = 5). ***p < 0.001 by Student’s t test. Error bars represent the standard error. |