
Fig. 4
- ID
- ZDB-FIG-180803-15
- Publication
- Takayama et al., 2018 - Leucine/glutamine and v-ATPase/lysosomal acidification via mTORC1 activation are required for position-dependent regeneration
- Other Figures
- All Figure Page
- Back to All Figure Page
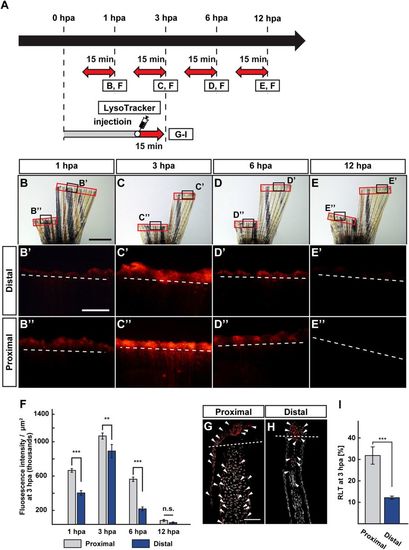
Position-dependent lysosomal acidification during fin regeneration. (A) Experimental scheme. Red two-headed-arrows indicate LysoTracker treatment, which was applied 15 min before observation. For cryosections, LysoTracker solution was injected into the amputated fins 15 min before fixation. (B–E”) Bright-field and fluorescent images of LysoTracker-treated fins at 1, 3, 6, and 12 hpa (n = 5). Black boxed areas in (B–E) are enlarged in (B’–E’ and B”–E”), respectively. The LysoTracker fluorescence intensities in red boxed areas were measured (B–E”). Representative images (B’–E”) used for quantification are shown in (F). White dashed lines indicate the amputation planes. Scale bars: 3 mm (B–E) and 500 μm (B’–E’ and B”–E”). (F) Quantification of Lysotracker fluorescence intensities at the proximal and distal positions at 1, 3, 6, and 12 hpa (n = 5). n.s.: not significant. ***p < 0.001, **p < 0.05 by Student’s t test. Error bars represent the standard error. (G–I) Longitudinal ray sections and quantification of ratios of LysoTracker fluorescence-positive cell number/total cell number (RLTs) within 500 μm of the amputation plane at 3 hpa (n = 5). Representative images (G,H) used for quantification are shown in (I). Arrowheads indicate LysoTracker fluorescence-positive cells (red). Scale bars: 50 µm (G,H) n.s.: not significant. ***p < 0.001 by Student’s t test. Error bars represent the standard error. |