
FIGURE
Fig. 6
Fig. 6
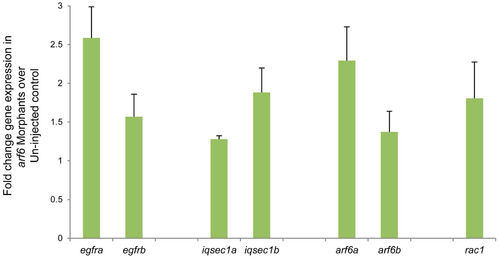
Quantitative RT-PCR analysis of EGFR pathway genes in liver tissue from zebrafish. The relative expression level of genes was shown in fold change in arf6 morphants over un-injected controls. Error bars shown, ± SEM (average of three independent experiments). |
Expression Data
| Genes: | |
|---|---|
| Fish: | |
| Knockdown Reagent: | |
| Anatomical Term: | |
| Stage: | Day 4 |
Expression Detail
Antibody Labeling
Phenotype Data
Phenotype Detail
Acknowledgments
This image is the copyrighted work of the attributed author or publisher, and
ZFIN has permission only to display this image to its users.
Additional permissions should be obtained from the applicable author or publisher of the image.
Full text @ PLoS One