
Fig. 4
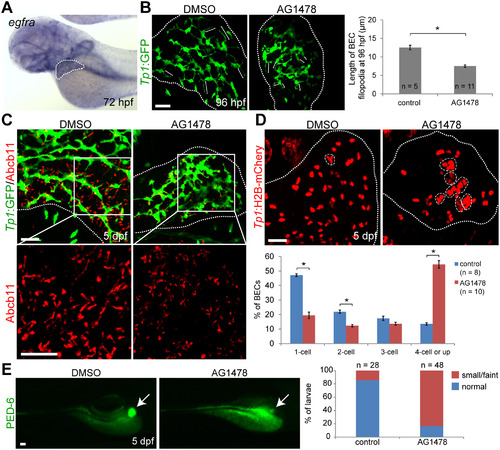
EGFR signaling regulates biliary morphogenesis. (A) Whole-mount in situ hybridization image showing egfra expression in the liver at 72 hpf. (B) Confocal images of the liver showing the intrahepatic biliary structure, as revealed by Tp1:GFP expression. Tg(Tp1:GFP) embryos were treated with DMSO or 4 µM AG1478 from 48 to 96 hpf, and processed for whole-mount immunostaining with anti-GFP antibody. The length of BEC filopodia was quantified as shown in a graph. Brackets delineate the length of BEC filopodia. (C) Confocal images of the liver showing the expression of Tp1:GFP (green) and Abcb11 (red) for biliary structure and bile canaliculi, respectively. (D) Confocal images of the liver showing the location of BEC nuclei in the entire liver, as assessed by Tp1:H2B-mCherry expression. Dashed lines outline clusters with four or more BECs. Graph showing the percentage of BECs present as single cells, doublets, triplets, or in clusters of four or more cells. (E) Epifluorescence images showing PED-6 accumulation in the gallbladder in DMSO- or AG1478-treated larvae at 5 dpf. Graph showing the percentage of larvae exhibiting different levels of PED-6 accumulation in the gallbladder. Arrows point to the gallbladder. All dotted lines outline the liver. n indicates the number of larvae examined; asterisks indicate statistical significance (* p<0.0001). Error bars, ± SEM; scale bars, 25 µm. |
| Gene: | |
|---|---|
| Fish: | |
| Anatomical Term: | |
| Stage: | Protruding-mouth |
| Fish: | |
|---|---|
| Condition: | |
| Observed In: | |
| Stage Range: | Day 4 to Day 5 |