
Fig. 3
- ID
- ZDB-FIG-150316-5
- Publication
- Maier et al., 2014 - RA and FGF Signalling Are Required in the Zebrafish Otic Vesicle to Pattern and Maintain Ventral Otic Identities
- Other Figures
- All Figure Page
- Back to All Figure Page
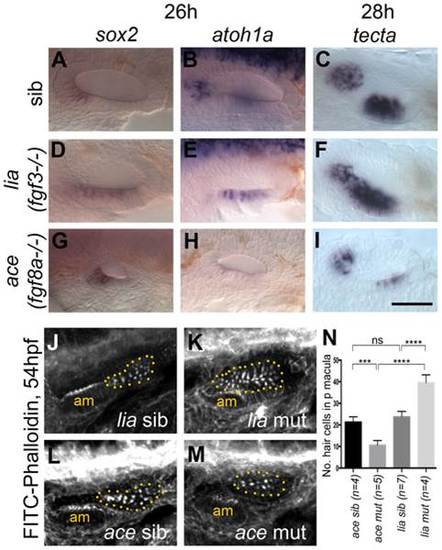
Expression of sensory markers in lia (fgf3-/-) and ace (fgf8a-/-) mutant embryos. (A–C) Phenotypically wild-type sibling (sib) embryos show normal expression of the sensory markers sox2, atoh1a and tecta. (D–F) In lia (fgf3-/-) embryos, expression of sox2 (n = 12/41 embryos from a heterozygous cross), atoh1a (n = 13/45) and tecta (n = 14/42) is extended in the ventral OV floor. (G–I) In ace (fgf8a-/-) embryos, expression of sox2 (n = 12/42), atoh1a (n = 10/39) and tecta (n = 14/54) shows normal spatial patterning, but while sox2 expression levels are slightly increased, atoh1a and tecta levels are reduced. (J–N) Dotted yellow line demarcates the area of the posterior macula in which FITC-Phalloidin-positive hair bundles were counted. (J,L,N) Phenotypically wild-type sibling (sib) embryos show normal numbers of hair cells (n = 7 ears counted, lia sib; n = 4, ace sib). (K) In lia (fgf3-/-) embryos the posterior macula is enlarged; only FITC-phalloidin-positive cells that appeared posterior-like and were located in the demarcated area were counted (n = 4 mutant ears). (M) In ace (fgf8a/) embryos, hair cells show a normal spatial pattern, but the size of the maculae appears reduced (n = 6 mutant ears). (N) Graphical representation of counts of Phalloidin-positive cells at 53–56 hpf in the demarcated area. Error bars represent standard deviation. One-way ANOVA with Šídák′s multiple comparison post-test: ***p<0.001, ****p<0.0001, ns = not significant. All panels are lateral views with anterior to the left, apart from the panels depicting tecta, which are dorsal views with anterior to the left, lateral up. Scale bar: 50 µm. |
| Genes: | |
|---|---|
| Fish: | |
| Anatomical Term: | |
| Stage: | Prim-5 |
| Fish: | |
|---|---|
| Observed In: | |
| Stage Range: | Prim-5 to Long-pec |