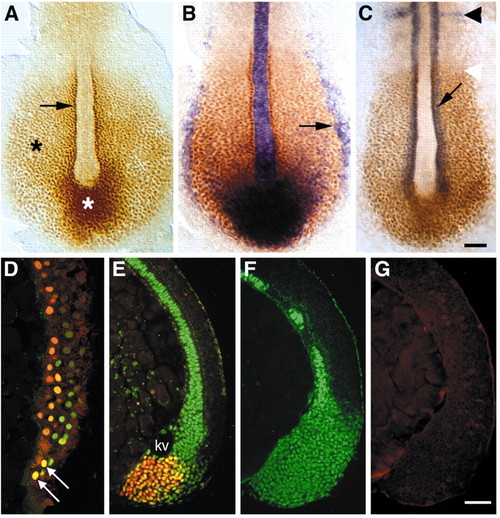
Two zebrafish T-box genes, ntl and spt, are co-expressed in gastrula cells at the blastoderm margin. Spt protein expression in wild-type (A-E) and spt– (F,G) embryos at midgastrula stage (70% epiboly) (D) and at the 6-somite stage (12 hpf) (A-C,E-F). (A) Spt is expressed strongly in adaxial (arrow) and tail bud (white asterisk) cells and more weakly in presomitic and lateral mesodermal cells (asterisk). (B) Double-labeling for Spt protein (brown) and ntl transcripts (blue); arrow indicates lateral presumptive pronephros. (C) Double-labeling for Spt protein (brown) and myoD transcripts (blue). Arrow indicates adaxial cells, black arrowhead indicates the posterior limit of myoD expression, and white arrowhead indicates the anterior extent of Spt protein expression. myoD is expressed in adaxial cells and in posterior cells of each formed somite (Weinberg et al., 1996). (D) Section through the lateral region of a midgastrula embryo (70% epiboly) double-labeled for Ntl (green) and Spt (orange) protein; white arrows indicate cells expressing both Ntl and Spt. (E) Sagittal section through the dorsal midline, double-labeled for Ntl (green) and Spt (orange); kv, Kuppfer’s vesicle. (F,G) Similar sections of spt– embryos double-labeled for Ntl (F) and Spt (G). Scale bars: 50 μm in C for A-C and in G for D-G.
|
