
Fig. 1
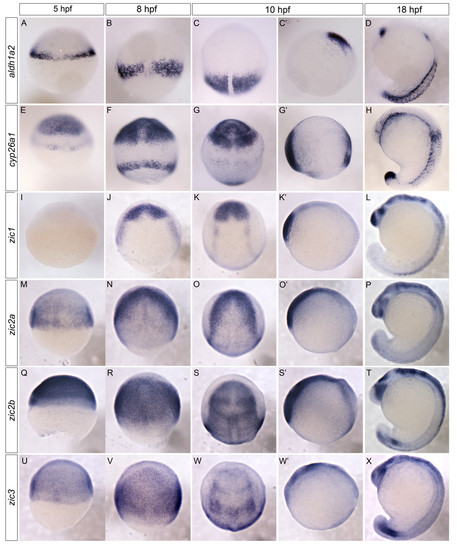
Temporal and spatial analysis of zic transcription factors and key RA synthesis and degradation genes.aldh1a2 expression is restricted to the embryonic margin at 5 hpf (A). By 8-10 hpf aldh1a2 is observed in the lateral plate mesoderm (B, C, C′). At 18 hpf, aldh1a2 is expressed in the dorsal retina and anterior somites (D). cyp26a1 is expressed in the embryonic margin and the presumptive anterior neural ectoderm at 5-8 hpf (E, F). By 10-18 hpf cyp26a1 is expressed in presumptive forebrain, midbrain, anterior hindbrain, retina, and part of the tailbud (G, G′, H). zic1 is not detectable until 8-10 hpf (75% epiboly), when it is expressed within the presumptive anterior neural tissue (I, J, K, K′). By 18 hpf, zic1 is expressed strongly in the telencephalon, midbrain-hindbrain boundary, dorsal hindbrain and spinal cord (L). zic2a initiates earlier, with dorsally-restricted expression at 5 hpf (50% epiboly) (M). By 8-10 hpf zic2a becomes anteriorly restricted within presumptive anterior neural tissue with additional midline expression (N, O, O′). By 18 hpf, zic2a is within the anterior forebrain, ventral eye, dorsal hindbrain and spinal cord (P). Initially, zic2b is expressed in a broad domain encompassing the dorsal side of the embryo (Q; 5 hpf). This broad expression is maintained at 8 hpf (R) and 10-18 hpf where expression is strongest within the eye, midbrain-hindbrain boundary, and presumptive hindbrain (S, S′, T). zic3 is also dorsally restricted at 5-8 hpf (U, V). At 10-18 hpf, zic3 is within the presumptive telencephalon, posterior forebrain, midbrain-hindbrain boundary and dorsal hindbrain, and within the tailbud (W, W′, X). Images are dorsal views with anterior to top (A-C, E-G, I-K, M-O, Q-S, U-W) or lateral views with anterior to left (C′, D, G′, H, K′, L, O′, P, S′, T, W′, X). hpf: hours post fertilization. |