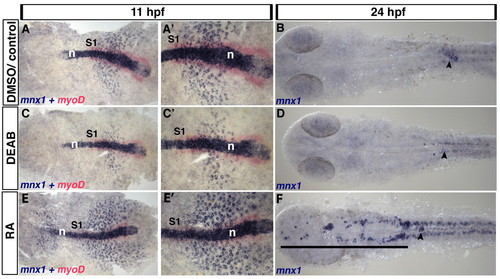
Endoderm expression of mnx1 is regulated by retinoic acid. (A-F) Control zebrafish embryos were treated with DMSO carrier (A,A′) or untreated (B). Retinoic acid (RA) signaling was blocked by DEAB treatment (C-D) or elevated by RA treatment (E-F). (A,C,E) In situ hybridization for mnx1 at 11 hpf shows punctate expression of mnx1 transcripts (blue) in the endoderm and high levels of expression in notochord. In situ hybridization for the mesodermal marker myod1 (myoD, red) marks the adaxial mesoderm at this stage up to the first somite (S1). (A2,C2,E2) Higher magnification views of A,C,E. At 24 hpf, mnx1 transcripts are localized to presumptive endocrine pancreas (B). DEAB treatment reduces the endodermal expression of mnx1 at 11 hpf (C,C′) and abolishes it at 24 hpf (arrowhead), whereas RA treatment increases the number of cells expressing mnx1 at 11 hpf (E,E′) and expands the mnx1-expressing pancreatic domain (arrowhead) towards the anterior (black line). Note that neither the notochord (A,C,E) nor the spinal cord motoneurons (B,D,F) show altered mnx1 expression in response to modulation of RA signaling. n, notochord.
|
