
Fig. 1
- ID
- ZDB-FIG-111025-43
- Publication
- Sun et al., 2007 - Epibranchial and otic placodes are induced by a common Fgf signal, but their subsequent development is independent
- Other Figures
- All Figure Page
- Back to All Figure Page
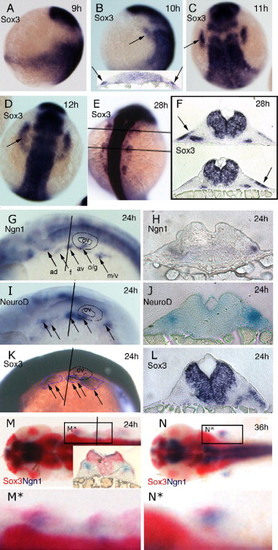
Expression of sox3 marks the developing epibranchial placodes. (A, B, G, I, K) Embryos viewed laterally with dorsal to right (A, B) or dorsal uppermost (G, I, K). (C–E, M, N) Embryos viewed dorsally with rostral uppermost (C–E) or to the left (M, N). In situ hybridization for sox3 expression shows its appearance in a small bilateral patch (arrow) of ectoderm (see insert in panel B showing t.s. section) either side of the hindbrain between 9 and 10 hpf (sox3 is also strongly expressed throughout the length of the CNS) (A, B). By 11 hpf (2–3 somites) these patches have formed parallel to the hindbrain adjacent to, but a short distance lateral to rhombomeres 3–5 (C). At 12 hpf (5–6 somites), the patches take on an arced shape with a pronounced sox3-negative domain nearest the CNS (D). At later stages the single domain appears to extend in the rostrocaudal axis and break into a series of smaller patches (E) that are again clearly seen to be ectodermal in sections (more medial expression of sox3 also seen in the endoderm of the pharyngeal pouches) (F). Comparison of single in situ hybridization for ngn1 (G, H), neuroD (I, J) and sox3 (K, L) at 24 hpf shows that these regions the regions of neurogenesis are closely associated with the ectodermal patches of sox3 expression. This is most evident from sections taken at equivalent positions just rostral to the otic vesicle (H, J, L). Double in situ hybridization with the early marker of neurogenesis, ngn1 (red) at 24 hpf (M) and 36 hpf (N), verified that these sox3 domains (blue) are indeed the regions from which neurons later arise (M,N) as shown in the transverse section, inset in (M). (M□) and (N□) represent enlarged views of boxed region in (M) and (N) respectively. ad, anterodorsal lateral line; av, anteroventral lateral line; f, facial; m/v, middle lateral line/vagal; o/g, octaval/statoacoustic/glossopharyngeal; ov, otic vesicle. |
| Genes: | |
|---|---|
| Fish: | |
| Anatomical Terms: | |
| Stage Range: | 90%-epiboly to Prim-5 |
Reprinted from Developmental Biology, 303(2), Sun, S.K., Dee, C.T., Tripathi, V.B., Rengifo, A., Hirst, C.S., and Scotting, P.J., Epibranchial and otic placodes are induced by a common Fgf signal, but their subsequent development is independent, 675-686, Copyright (2007) with permission from Elsevier. Full text @ Dev. Biol.