
FIGURE
Fig. S15
- ID
- ZDB-FIG-101129-30
- Publication
- Baskin et al., 2010 - Visualizing enveloping layer glycans during zebrafish early embryogenesis
- Other Figures
- All Figure Page
- Back to All Figure Page
Fig. S15
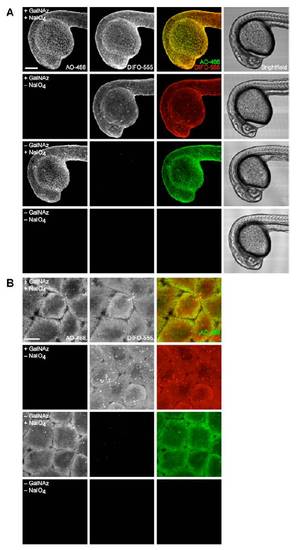
Simultaneous visualization of O-glycans and sialylated glycans at 24 hpf. Zebrafish embryos were microinjected with GalNAz or no sugar, allowed to develop to 24 hpf, and then bathed in NaIO4 (500 μM, 30 min) or no reagent. Embryos were then reacted in a mixture of DIFO-555 (100 μM) and AO-488 (100 μM) in PBS (pH 6.7) for 1 h and imaged by confocal microscopy. Shown are maximum intensity z-projection fluorescence images and corresponding brightfield images. Green, AO-488; red, DIFO-555. Scale bars: 200 μm (A), 20 μm (B). |
Expression Data
Expression Detail
Antibody Labeling
Phenotype Data
Phenotype Detail
Acknowledgments
This image is the copyrighted work of the attributed author or publisher, and
ZFIN has permission only to display this image to its users.
Additional permissions should be obtained from the applicable author or publisher of the image.
Full text @ Proc. Natl. Acad. Sci. USA