
FIGURE
Fig. S4
- ID
- ZDB-FIG-101129-19
- Publication
- Baskin et al., 2010 - Visualizing enveloping layer glycans during zebrafish early embryogenesis
- Other Figures
- All Figure Page
- Back to All Figure Page
Fig. S4
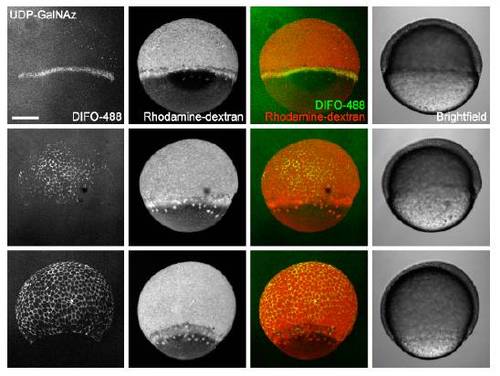
Manual dechorionation with forceps does not afford labeling before 65% epiboly. Zebrafish embryos were microinjected with 25 pmol of UDP-GalNAz and the tracer dye rhodamine-dextran, manually dechorionated using forceps at 3 hpf, and allowed to develop to 50% epiboly (5.5 hpf, 1st row), 65% epiboly (7 hpf, 2nd row), or 80% epiboly (8.5 hpf, 3rd row). Embryos were then reacted with DIFO-488 (100 μM, 1 h) and imaged by confocal microscopy. Shown are maximum intensity z-projection fluorescence images and corresponding brightfield images. Green, DIFO-488; red, rhodamine-dextran. Scale bar: 200 μm. |
Expression Data
Expression Detail
Antibody Labeling
Phenotype Data
Phenotype Detail
Acknowledgments
This image is the copyrighted work of the attributed author or publisher, and
ZFIN has permission only to display this image to its users.
Additional permissions should be obtained from the applicable author or publisher of the image.
Full text @ Proc. Natl. Acad. Sci. USA