
Fig. S10
- ID
- ZDB-FIG-101129-25
- Publication
- Baskin et al., 2010 - Visualizing enveloping layer glycans during zebrafish early embryogenesis
- Other Figures
- All Figure Page
- Back to All Figure Page
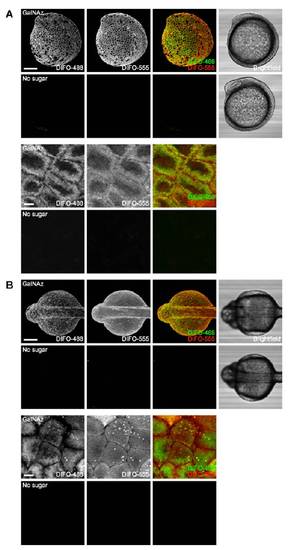
Multicolor imaging of time-resolved populations of GalNAz-labeled glycans. Zebrafish embryos were microinjected with 25 pmol of GalNAz or no sugar and allowed to develop to 9 hpf, at which point they were reacted with DIFO-488 (100 μM, 1 h). The embryos were then allowed to further develop for 2 h (A) or 12 h (B), at which point they were reacted with DIFO-555 (100 μM, 1 h) and then imaged by confocal microscopy. Shown are maximum intensity z-projection fluorescence images of surface epithelial cells and corresponding brightfield images. Green, DIFO-488; red, DIFO-555. Scale bars: 200 μm (1st, 2nd, 5th, and 6th rows), 10 μm (3rd, 4th, 7th, and 8th rows). |