
Fig. S2
- ID
- ZDB-FIG-101129-17
- Publication
- Baskin et al., 2010 - Visualizing enveloping layer glycans during zebrafish early embryogenesis
- Other Figures
- All Figure Page
- Back to All Figure Page
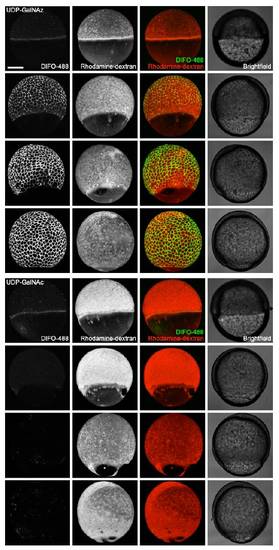
In vivo imaging of glycans during epiboly using microinjection of UDP-GalNAz and detection with copper-free click chemistry. Zebrafish embryos were microinjected with 25 pmol of UDP-GalNAz (top) or UDP-GalNAc (bottom), along with the tracer dye rhodaminedextran, and allowed to develop to 50% epiboly (5.5 hpf, 1st and 5th rows), 65% epiboly (7 hpf, 2nd and 6th rows), 80% epiboly (8.5 hpf, 3rd and 7th rows), or 95% epiboly (9.5 hpf, 4th and 8th rows). Embryos were then reacted with DIFO-488 (100 μM, 1 h) and imaged by confocal microscopy. Shown are maximum intensity z-projection fluorescence images and corresponding brightfield images. Embryos are orientated with the animal pole up, but randomly with respect to the dorsal-ventral axis. Faint azide-independent signal at 50% epiboly is due to nonspecific uptake of DIFO-488 by rapidly endocytosing dorsal forerunner cells. Green, DIFO-488; red, rhodamine-dextran. Scale bar: 200 μm. |