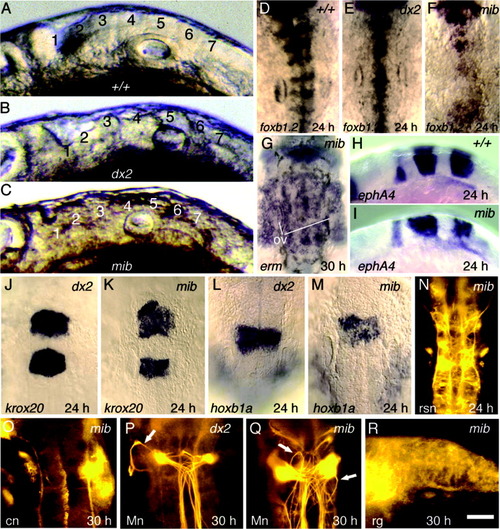
Hindbrain patterning in Delta-Notch mutants. A-C: Hindbrain morphology at 24 hours postfertilization (hpf) in wild-type (A), dlAdx2 (B), and mibta52b (C) embryos. Positions of rhombomeres 1-7 are indicated. D-F: Dorsal views, showing expression of foxb1.2 at 24 hpf in wild-type (D), dlAdx2 (E), and mibta52b (F) embryos. G: erm expression in mibta52b at 30 hpf. The otic vesicles (ov) are indicated to serve as landmarks. H,I: ephA4 expression at 24 hpf in a wild-type embryo (H) and a mibta52b mutant (I). J,K: Expression of krox20 at 24 hpf in dlAdx2 (J) and mibta52b (K) embryos. L,M: Expression of hoxb1a at 24 hpf in dlAdx2 (L) and mibta52b (M) embryos. N: Reticulospinal neurons (rsn) in a mibta52b mutant labeled with anti-acetylated tubulin at 24 hpf. O: zn8 antibody staining of a mibta52b mutant at 30 hpf shows that commissural neurons (cn) are not produced. P,Q: Mauthner neurons (Mn) labeled with 3A10 antibody at 30 hpf in dlAdx2 (P) and mibta52b (Q) embryos. Abnormal axonal trajectories are indicated (arrows). R: Radial glia (rg) labeled with zrf1-4 antibodies at 30 hpf in a mibta52b mutant. Images show lateral views with anterior to the left (A-C,H,I,R) or dorsal views with anterior to the top (D-G,J-Q). Scale bar in R = 55 μm in A-C, 75 μm in O-Q, 100 μm in R,125 μm in D-N.
|
