|
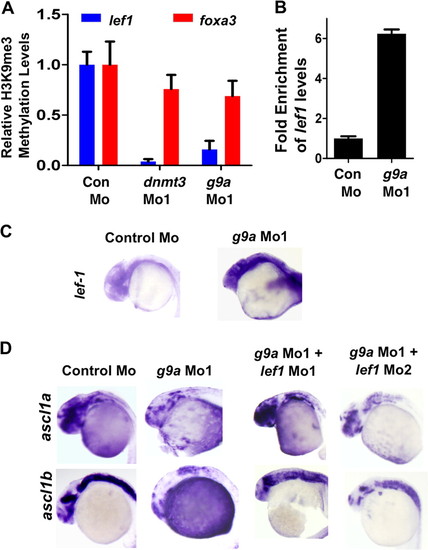
Lef1 repression by G9a is critical for proper neurogenesis. A, quantitative PCR for chromatin immunoprecipitation for H3K9me3 marks on lef1 promoter (Blue) or on foxa3 promoter (Red) in control morphant, dnmt3 morphant, and g9a morphant embryos. Values shown represent enrichment on the experimental region normalized to values on control region. B, graph showing quantitative RT-PCR results for zebrafish lef1 normalized to 28S values in control morpholino or g9a morpholino-injected embryos at 24 hpf. Results are represented in a -fold change format where the lef1/28S ratio from control morphants was normalized to 1. C, expression of lef1 in control and g9a morphant embryos at 24 hpf as detected by whole mount in situ hybridization. D, whole mount in situ analysis of ascl1a and ascl1b expression in embryos (30 hpf) injected with control morpholino and g9a morpholino co-injected with either lef1 Mo1 or lef1 Mo2.
|