|
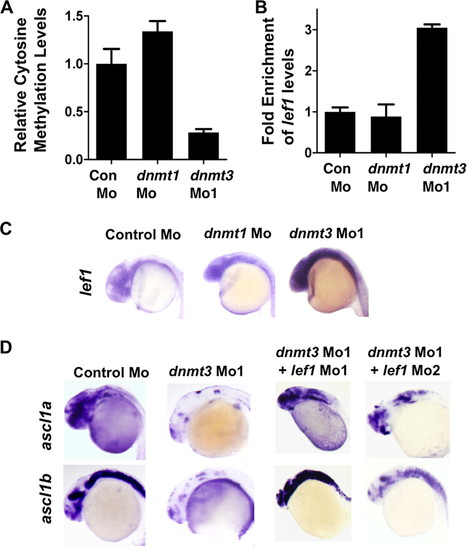
Lef1 repression by Dnmt3 is critical for proper neurogenesis. A, MeDIP-PCR based quantification of methylation status of lef1 promoter in control, dnmt1, and dnmt3 morphant embryos at 24 hpf. The y-axis represents values at lef1 promoter first normalized to a negative region (with an insignificant number of CpGs in 1000 bp vicinity) and then normalized to control Mo values as 1. B, graph showing quantitative RT-PCR results for zebrafish lef1 normalized to 28 S values in control morpholino-, dnmt1 morpholino-, or dnmt3 morpholino-injected embryos at 24 hpf. Results are represented in a -fold change format where the lef1/28S ratio from control morphants was normalized to 1. C, expression of lef1 in control, dnmt1, and dnmt3 morphant embryos at 24 hpf as detected by whole mount in situ hybridization. D, whole mount in situ analysis of ascl1a and ascl1b expression in embryos (30 hpf) injected with control morpholino and dnmt3 morpholino co-injected with either lef1 Mo1 or lef1 Mo2.
|