
FIGURE
Fig. 6
Fig. 6
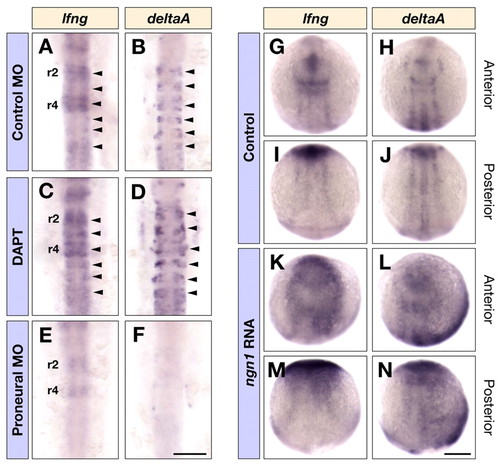
Regulation of lfng expression. (A-F) Dorsal views of control MO (A,B) and triple ascl1a, ascl1b and ngn1 MO (E,F) injected embryos, or DAPT (C,D) treated embryos at 16 hpf showing lfng (A,C,E) and deltaA (B,D,F) expression in the hindbrain. Arrowheads in A-D indicate the expression of lfng and deltaA in the middle of each rhombomere. (G-N) Dorsal views of control (G-J) and ngn1 RNA (K-N) injected embryos at ∼3-somite stage showing lfng (G,I,K,M) and deltaA (H,J,L,N) expression in the anterior and posterior neural plate. Scale bars: 100 μm in F for A-F; 200 μm in N for G-N. |
Expression Data
| Genes: | |
|---|---|
| Fish: | |
| Condition: | |
| Knockdown Reagents: | |
| Anatomical Terms: | |
| Stage Range: | 1-4 somites to 14-19 somites |
Expression Detail
Antibody Labeling
Phenotype Data
Phenotype Detail
Acknowledgments
This image is the copyrighted work of the attributed author or publisher, and
ZFIN has permission only to display this image to its users.
Additional permissions should be obtained from the applicable author or publisher of the image.
Full text @ Development