
Fig. 7
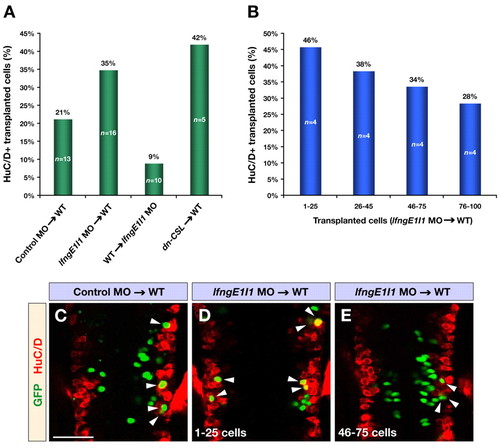
Mosaic analysis of Lfng function. (A) Transplantations of cells from control or lfngE1I1 MO- and dn-CSL RNA-injected donor embryos into wild-type or lfngE1I1 MO-injected hosts. The bar graph shows the percentage of transplanted cells that have differentiated into neurons marked by HuC/D. For lfngE1I1 MO and dn-CSL cells transplanted into wild-type hosts, only embryos with <100 transplanted cells are included. All changes were significant compared with control MO transplantations (P<0.03). (B) Analysis of lfngE1I1 MO cells transplanted into wild-type embryos. The bar graph shows the percentage of Lfng-deficient cells that have differentiated into neurons marked by HuC/D. Note the linear relationship between the increasing number of transplanted cells and decreasing number of transplanted cells differentiating into neurons. (C-E) Confocal images of dorsal views of wild-type embryos transplanted with control MO (C) and lfngE1I1 MO (D,E) injected cells at 24 hpf immunostained for GFP (green) and HuC/D (red) to mark transplanted cells and postmitotic neurons, respectively. The embryo in E contains a higher number of transplanted cells compared with the one in D. Arrowheads indicate transplanted cells that have differentiated into neurons. Scale bar: 50 μm. |