
Fig. 5
- ID
- ZDB-FIG-090617-34
- Publication
- Bae et al., 2009 - Anatomy of zebrafish cerebellum and screen for mutations affecting its development
- Other Figures
- All Figure Page
- Back to All Figure Page
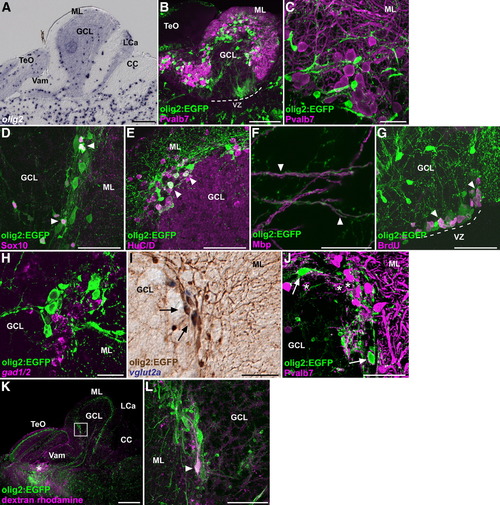
olig2+ cells. (A) Expression of olig2 in the adult cerebellum. A sagittal section. (B, C) Co-staining of a Tg(olig2:EGFP) brain with anti-Pvalb7 (magenta) and anti-EGFP (green) antibodies. Low (B) and high (C) magnification views. Note that the EGFP signals never overlap with Pvalb7. The ventricular zone (VZ) is indicated by a dotted line (B). (D–F) Co-staining of the Tg(olig2:EGFP) brain with anti-EGFP antibodies (green), and anti-Sox10 (D), anti-HuC/D (E), or anti-Mbp (F, magenta). Sagittal sections and in the posterior CCe (D), and anterior CCe (E) and GCL (F). Note that olig2:EGFP+ cells that have a small size were stained with anti-Sox10 antibody (arrowheads in D); those having a large cell size were stained with anti-HuC/D antibody (arrowheads in E). olig2:EGFP+ cellular processes do not overlap with Mbp+ oligodendrocytic processes, but rather are adjacent to them (arrowheads in F). (G) BrdU incorporation. Adult Tg(olig2:EGFP) fish were labeled with bromodeoxyuridine (BrdU) for 1 h, and the proliferating cells were analyzed by immunostaining with anti-BrdU (magenta) and anti-EGFP antibodies (green). A sagittal section. The VZ is indicated a dotted line. Note that some of olig2:EGFP+ cells incorporated BrdU (arrowheads). (H) Co-staining of the Tg(olig2:EGFP) brain with a gad1/gad2 riboprobe (magenta) and anti-EGFP antibody (green). olig2:EGFP signals do not overlap with gad1/2 expression. (I) Co-staining of the Tg(olig2:EGFP) cerebellum with a vglut2a riboprobe (purple, NBT/BCIP staining) and anti-EGFP antibodies (brown, DAB staining). Note that some of the olig2:EGFP+ cells express vglut2a. (J) Co-staining of the Tg(olig2:EGFP) cerebellum with anti-Pvalb7 (magenta) and anti-EGFP (green) antibodies. Note that some of olig2:EGFP+ somata (arrows) receive synaptic inputs from Pvalb7+ axons of Purkinje cells. The olig2:EGFP- eurydendroid cells are marked by asterisks. (K, L) Retrograde labeling of eurydendroid cells. The neural tracer was injected into the pretectal region (asterisk, K) of the Tg(olig2:EGFP) adult fish and the brain was stained with the fluorescent avidin (magenta) and anti-EGFP antibodies. (L) High-magnification view of the box in K. Note that an olig2:EGFP+ cell (arrowhead) incorporated the neural tracer. The abbreviations are described in Fig. 1. Scale bars: 200 μm (A, B, K), 50 μm (D, E, G, I), and 20 μm (C, F, H, J, L). |
| Genes: | |
|---|---|
| Antibody: | |
| Fish: | |
| Anatomical Terms: | |
| Stage: | Adult |
Reprinted from Developmental Biology, 330(2), Bae, Y.K., Kani, S., Shimizu, T., Tanabe, K., Nojima, H., Kimura, Y., Higashijima, S.I., and Hibi, M., Anatomy of zebrafish cerebellum and screen for mutations affecting its development, 406-426, Copyright (2009) with permission from Elsevier. Full text @ Dev. Biol.