|
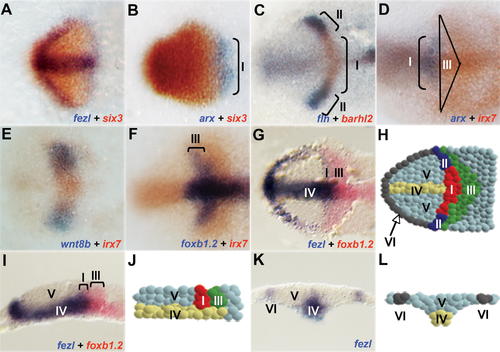
Expression Profile of the Rostral Neural Plate (A–G) Rostral neural plate, anterior to the left. Embryos at bud stage (A–D, F, G , I, and K) or 100% epiboly (E) are shown. (A) six3 (red), fezl (blue). (B) six3 (red), arx (blue). (C) barhl2 (red), flh (blue). (D) irx7 (red), arx (blue). (E) irx7 (red), wnt8b (blue). (F) irx7 (red), foxb1.2 (blue). (G) foxb1.2 (red), fezl (blue). (H) Scheme of the different expression domains inside the diencephalon anlage shown in (A–G). (I) Sagittal section, anterior left, foxb1.2 (red), fezl (blue). (J) Scheme of (I). (K) Transverse section, fezl (blue). (L) Scheme of (K). The different domains are the presumptive anteromedial (I), anterolateral (II), and posterior (III) diencephalon, hypothalamus (IV), and eye field (V).
|