FIGURE SUMMARY
Title

The Antioxidant Drug Edaravone Binds to the Aryl Hydrocarbon Receptor (AHR) and Promotes the Downstream Signaling Pathway Activation

Authors
Veroni, C., Olla, S., Brignone, M.S., Siguri, C., Formato, A., Marra, M., Manzoli, R., Macario, M.C., Ambrosini, E., Moro, E., Agresti, C.
Source
Full text @ Biomolecules

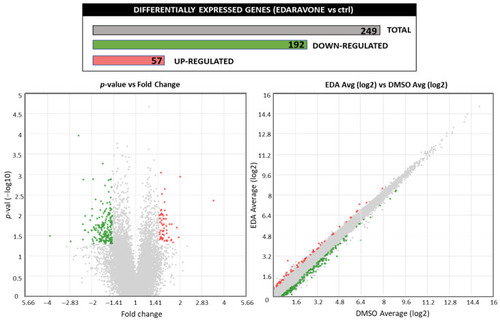
Effect of EDA treatment on the OPC transcriptome. Purified OPCs were incubated with 100 µM EDA or vehicle alone (DMSO) for 14 h. RNA was extracted, reverse transcribed and subjected to targeted transcriptome analysis. Treatment with EDA regulated the expression of 249 genes ranging in a ±1.5-fold change with a p-value < 0.05. The volcano plot shows statistical significance (p-value) versus the magnitude of change (fold change); red and green dots represent the up- and down-regulated genes, respectively. The image was edited using BioRender.com (https://www.biorender.com/ accessed on 3 April 2024).

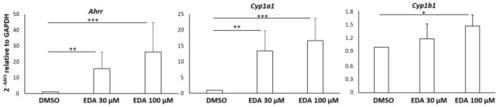
Validation of the effect of EDA treatment on AHR-related transcript expression in OPCs. OPCs were treated with EDA 30 µM, 100 µM or vehicle (DMSO) alone for 14 h. Total RNA was extracted and reverse transcribed and then the expression of the selected genes was evaluated using qPCR. Data are expressed as 2−ΔΔCt relative to the housekeeping gene Gapdh. Bars represent the mean ± SEM of 5 independent experiments. * p < 0.05, ** p < 0.01 and *** p < 0.001 with unpaired Student’s t-test. The image was edited using BioRender.com (https://www.biorender.com/ accessed on 3 April 2024).

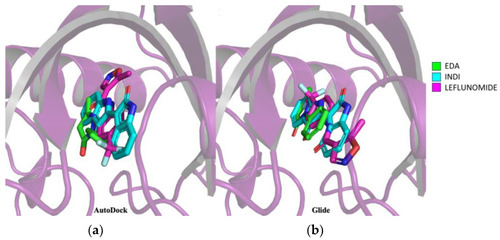
Prediction of EDA–AHR binding mode by molecular docking. (a) Superimposition of docking results on AHR of EDA in green, INDI in cyan and leflunomide in magenta using Autodock 4 software. (b) Superimposition of docking results on AHR of EDA in green, INDI in cyan and leflunomide in magenta using Glide software. In the 3D structures of the docked compounds, the oxygen atom is represented in red, nitrogen in blue while the fluorine atoms of leflunomide are represented in light blue. The image was edited using BioRender.com (https://www.biorender.com/ accessed on 3 April 2024).

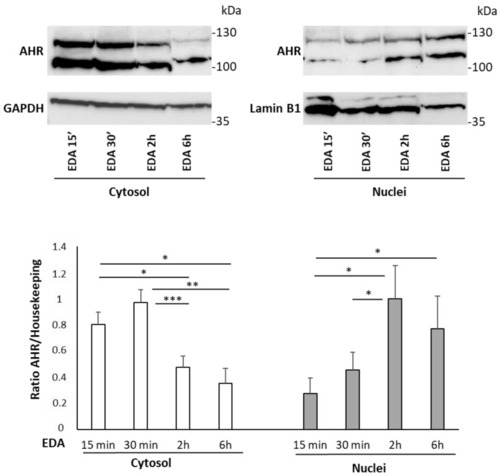
EDA induction of AHR nuclear translocation in the SH-SY5Y neuroblastoma cell line. SH-SY5Y human neuroblastoma cells were incubated with 100 µM EDA for 15 min, 30 min, 2 h and 6 h. The cytosolic and nuclear fractions were separated and the expression level of AHR in each fraction was evaluated by Western blot analysis. GAPDH and LAMINB1 were used for protein content normalization in cytosol and nuclei, respectively. Bars represent the mean ± SEM of 4 experiments. * p < 0.05, ** p < 0.01 and *** p < 0.001 by 2-way ANOVA analysis for repeated measures. For AHR protein quantification, the higher MW band has been considered. The image was edited using BioRender.com (https://www.biorender.com/ accessed on 3 April 2024).

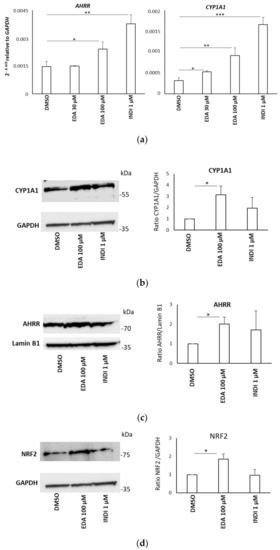
EDA induction of AHR target genes in the SH-SY5Y neuroblastoma cell line. (a) SH-SY5Y cells were incubated with 30 µM EDA, 100 µM EDA, 1 µM INDI or DMSO alone for 14 h. Total RNA was extracted and the expression of AHRR and CYP1A1 transcripts was evaluated using qPCR. Data are expressed as 2−ΔCt relative to the housekeeping gene GAPDH. (bd). SH-SY5Y cells were treated with 100 µM EDA, 1 µM INDI or DMSO alone for 24 h and CYP1A1 (b), AHRR (c) and NRF2 (d) protein expression was investigated by Western blot. Data are expressed as the ratio between AHR and the GAPDH reference. Bars represent the mean ± SEM of 3 experiments. * p < 0.05, ** p < 0.01 and *** p < 0.001 using unpaired Student’s t-test. The image was edited using BioRender.com (https://www.biorender.com/ accessed on 3 April 2024).

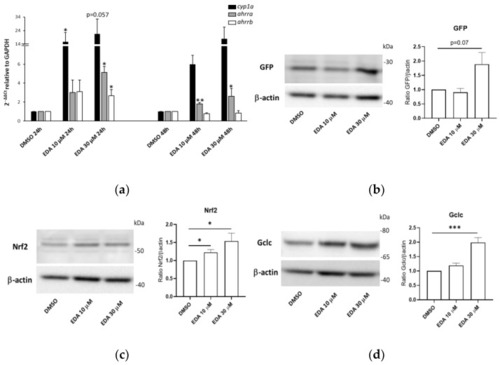
EDA promotes AHR and NRF2 pathway activation in zebrafish larvae. (a) cyp1a, ahrra and ahrrb transcript expression in zebrafish larvae at 56 hpf treated with vehicle (DMSO) or 10 or 30 µM EDA for 24 and 48 h. Asterisks above bars indicate statistically significant changes compared to DMSO-treated (control) samples. (b) Representative Western blot for the eGFP reporter protein on fish trunk whole lysates from control DMSO and EDA-treated Tg(8x AORE:EGFP)ia201 larvae at 56 hpf. Fish were treated for 48 consecutive hours. For both gene expression and Western blot analysis, data are expressed as the mean ±SEM of 4 biological replicates (10 larvae per replicate). (c,d) Representative Western blot for Nrf2 and Gclc proteins on fish trunk whole lysates from control DMSO and EDA-treated larvae at 56 hpf. Data are expressed as the mean ± SEM of 6 biological replicates (10 larvae per replicate). * p < 0.05, ** p < 0.01 and *** p < 0.001 with unpaired Student’s t-test. The image was edited using BioRender.com (https://www.biorender.com/ accessed on 3 April 2024).

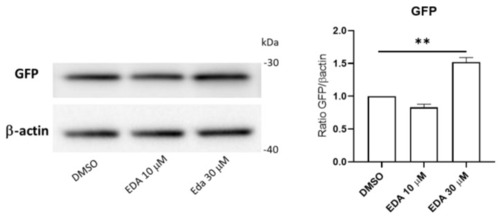
EDA treatment induces reporter expression in Olig2 transgenic fish. Representative Western blot for the eGFP reporter protein on fish trunk whole lysates from control DMSO and EDA-treated Tg(Olig2:eGFP)vu12 transgenic fish. Data are expressed as the mean ± SEM of 3 biological replicates (10 larvae per replicate). ** p < 0.01 with unpaired Student’s t-test. The image was edited using BioRender.com (https://www.biorender.com/ accessed on 3 April 2024).

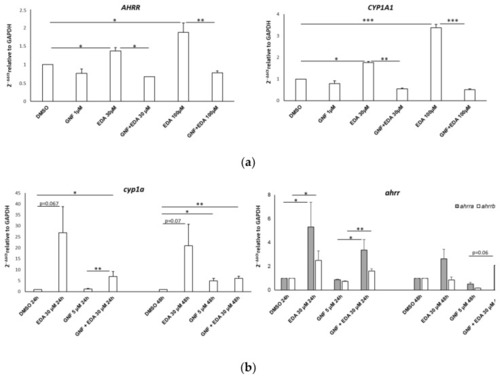
AHR inhibition curtails EDA-mediated AHR target gene upregulation in vitro and in vivo. Bar graphs show the gene expression levels detected by qPCR on RNA obtained from SH-SY5Y cells (a) and zebrafish larvae (b). Cells were treated with DMSO, 30 µM or 100 µM EDA and/or 1 µM GNF-351 for 24 h. (b) Zebrafish larvae at 8 hpf were treated with DMSO or 30 µM EDA in the presence or absence of 1 µM GNF-351 for 24 h and 48 h. The mean ± SEM of 3 experiments is shown. * p < 0.05, ** p < 0.01 and *** p < 0.001 with unpaired Student’s t-test. The image was edited using BioRender.com (https://www.biorender.com/ accessed on 3 April 2024).

Acknowledgments
This image is the copyrighted work of the attributed author or publisher, and ZFIN has permission only to display this image to its users. Additional permissions should be obtained from the applicable author or publisher of the image. Full text @ Biomolecules