
Image
|
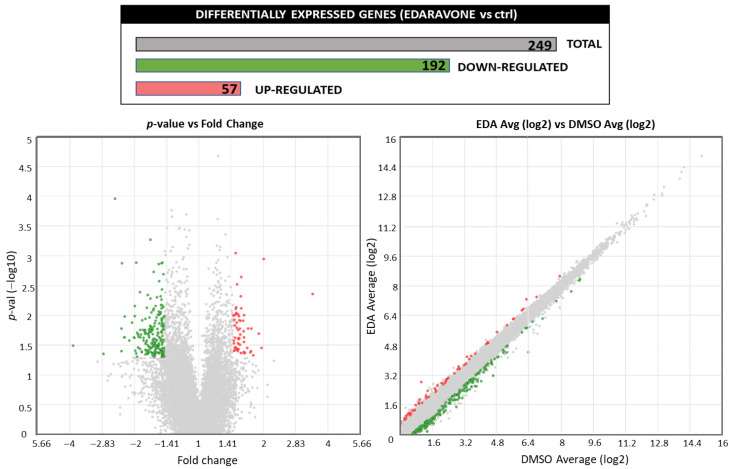
Figure Caption
Figure 1
Effect of EDA treatment on the OPC transcriptome. Purified OPCs were incubated with 100 µM EDA or vehicle alone (DMSO) for 14 h. RNA was extracted, reverse transcribed and subjected to targeted transcriptome analysis. Treatment with EDA regulated the expression of 249 genes ranging in a ±1.5-fold change with a
Acknowledgments
This image is the copyrighted work of the attributed author or publisher, and
ZFIN has permission only to display this image to its users.
Additional permissions should be obtained from the applicable author or publisher of the image.
Full text @ Biomolecules