IMAGE

Figure 8

ID
ZDB-IMAGE-240429-137
Source
Figures for Veroni et al., 2024
Image
Figure Caption

Figure 8

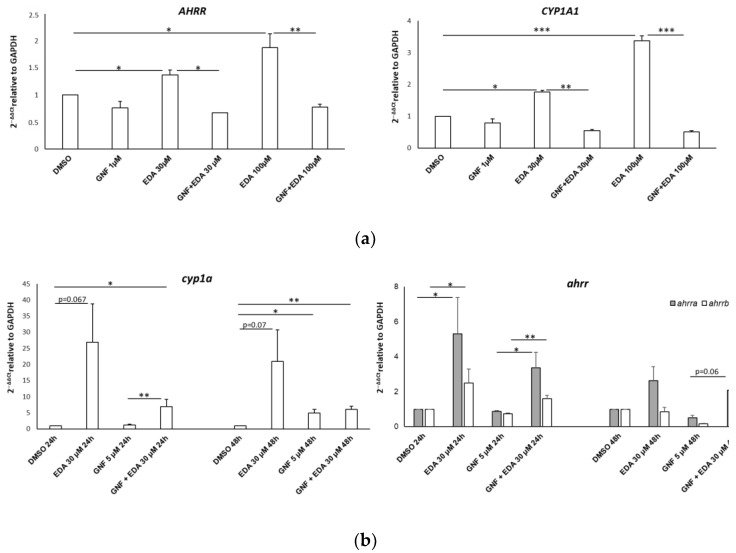
AHR inhibition curtails EDA-mediated AHR target gene upregulation in vitro and in vivo. Bar graphs show the gene expression levels detected by qPCR on RNA obtained from SH-SY5Y cells (a) and zebrafish larvae (b). Cells were treated with DMSO, 30 µM or 100 µM EDA and/or 1 µM GNF-351 for 24 h. (b) Zebrafish larvae at 8 hpf were treated with DMSO or 30 µM EDA in the presence or absence of 1 µM GNF-351 for 24 h and 48 h. The mean ± SEM of 3 experiments is shown. * p < 0.05, ** p < 0.01 and *** p < 0.001 with unpaired Student’s t-test. The image was edited using BioRender.com (https://www.biorender.com/ accessed on 3 April 2024).

Acknowledgments
This image is the copyrighted work of the attributed author or publisher, and ZFIN has permission only to display this image to its users. Additional permissions should be obtained from the applicable author or publisher of the image. Full text @ Biomolecules