
Image
|
Figure Caption
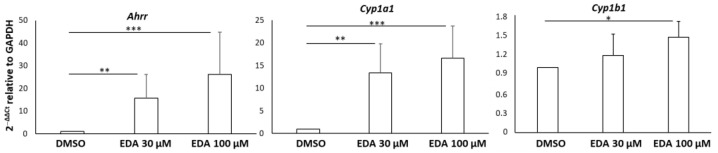
Figure 2
Validation of the effect of EDA treatment on AHR-related transcript expression in OPCs. OPCs were treated with EDA 30 µM, 100 µM or vehicle (DMSO) alone for 14 h. Total RNA was extracted and reverse transcribed and then the expression of the selected genes was evaluated using qPCR. Data are expressed as 2−ΔΔCt relative to the housekeeping gene
Acknowledgments
This image is the copyrighted work of the attributed author or publisher, and
ZFIN has permission only to display this image to its users.
Additional permissions should be obtained from the applicable author or publisher of the image.
Full text @ Biomolecules