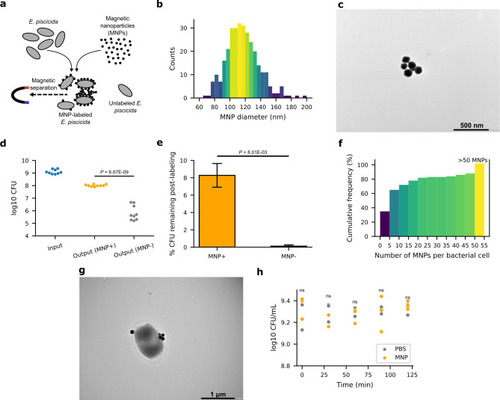
MNPs bind to the surface of
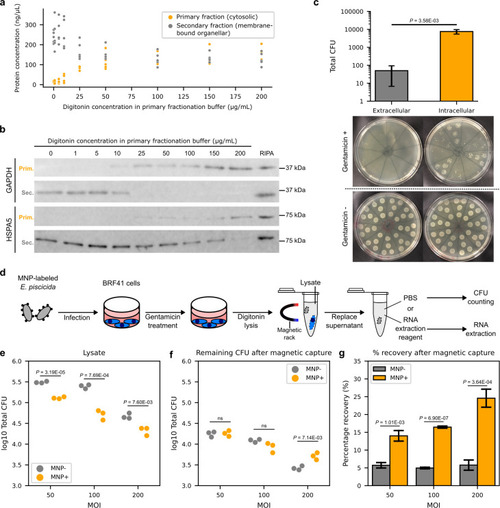
 E. piscicida without affecting its viability. (a) Schematic showing the labeling of E. piscicida with MNPs and their separation from unlabeled bacteria by magnetic capture. (b and c) Size distribution (b) and TEM micrograph (c) of MNPs in the supernatant of a diluted, sonicated, and centrifuged commercial stock solution. n = 312 MNPs. (d) Log10 total colony-forming units (CFU) before (input, blue) and remaining after (output) magnetic capture of E. piscicida incubated with MNPs (MNP+, orange) or phosphate-buffered saline (PBS) (MNP−, gray). (e) Percentage of initial input CFU remaining after magnetic capture of MNP-labeled (MNP+) or mock-labeled (MNP−) E. piscicida from panel d. (f) Cumulative frequency of the number of MNPs labeled to the surface of bacterial cells. Labeled MNPs exceeding 50 are grouped into one bin. n = 102 bacteria. (g) Representative TEM micrograph of an E. piscicida cell with five MNPs labeled to its surface. (h) Log10 viable CFU sampled over 2 h of incubation of E. piscicida with MNPs (orange) or PBS (gray). Data points in panel d are from three independent experiments, each performed with three biological replicates. Shown in panel e are the mean ± s.d. of the means from three independent experiments. Data points in panel h are from three biological replicates at each time point. Scale bars: (c) 500 nm; (g) 1 µm. Data were analyzed using two-tailed unpaired Student’s t-test (d, e, and h). P < 0.05 are displayed and otherwise marked as ns.

MNP-labeled E. piscicida can be magnetically separated from zebrafish fibroblast lysates. (a) Protein concentrations in the subcellular fractions of sequentially fractionated zebrafish fibroblasts primarily lysed with varying concentrations of digitonin. (b) Western blot of cytosolic glyceraldehyde-3-phosphate dehydrogenase, GAPDH, and the ER lumen protein, HSPA5/BiP, in the primary (Prim.) and secondary (Sec.) subcellular fractions of zebrafish fibroblasts primarily lysed with varying concentrations of digitonin. Whole-cell lysates in RIPA buffer were loaded as a control. (c) Total colony-forming unit (CFU) in the cell culture medium (extracellular) and lysates (intracellular) of zebrafish fibroblasts infected with E. piscicida at a multiplicity of infection (MOI) of 50 and treated with gentamicin for 3 h. The extracellular and intracellular CFU in non-treated cells (Gentamicin−) were innumerable at the same dilutions used to count CFUs from treated cells (Gentamicin+). (d) Schematic showing the procedure of infecting zebrafish fibroblasts with MNP-labeled E. piscicida and their subsequent separation from host lysates by a magnetic rack for CFU counting or RNA extraction. (e) Log10 total CFU in the lysates of zebrafish fibroblasts infected with MNP-labeled (MNP+) or unlabeled (MNP−) E. piscicida at MOIs of 50, 100, or 200. (f) Remaining CFU after magnetic capture of lysates in panel e. (g) Percentage of recovery of CFU after magnetic capture of lysates from panels e and f. Data points in panel a are from five independent experiments. Data points in panels e and f are from three biological replicates. Shown in panels c and g are the mean ± s.d. of three biological replicates. Data were analyzed using two-tailed unpaired Student’s t-test (c, e–g). P < 0.05 are displayed and otherwise marked as ns.

Enrichment of E. piscicida RNA from infected zebrafish fibroblasts allows comprehensive analysis of gene expression. (a) Electropherogram of pure E. piscicida (EtPo1) and zebrafish fibroblast (BRF41) RNA and mock mixed RNA at host:bacteria mass ratios of 1:1, 2:1, 4:1, and 8:1 (left panel). Representative electropherogram of RNA extracted from infected BRF41 cells by different methods (right panel): TOT, total RNA extraction; MNP, MNP enrichment method; and CENT, centrifugation enrichment method. The left and right panel electropherograms were obtained from running samples on an Agilent RNA ScreenTape and a High Sensitivity RNA ScreenTape, respectively. Electropherogram lanes are scaled to the highest intensity peak. Blue and red arrows next to the electropherograms represent host and bacterial ribosomal RNAs, respectively. (b) Percentage of total fragments mapped to the E. piscicida EtPo1 genome in enriched (MNP, CENT) and non-enriched (TOT) RNAs from infected BRF41 cells, and from control, broth-cultured bacteria (CTRL). (c) Principal component analysis of gene expression data in enriched (MNP, CENT), non-enriched (TOT), and control, broth-cultured (CTRL) E. piscicida RNAs. (d) Number of common DEGs (FDR < 0.001) between the MNP-enriched RNAs and centrifugation-enriched RNAs. (e) Map of the E. piscicida EtPo1 genome (light blue ring) showing the locations of all upregulated (red bars) and downregulated (blue bars) genes. The T3SS and T6SS loci are highlighted as green and light green bars, respectively, in the outer ring. (f) Heatmap of the normalized fragments per kilobase million (FPKM) expression values of genes in the T3SS (left) and T6SS (right) loci. Upregulated and downregulated genes are colored red and blue, respectively.

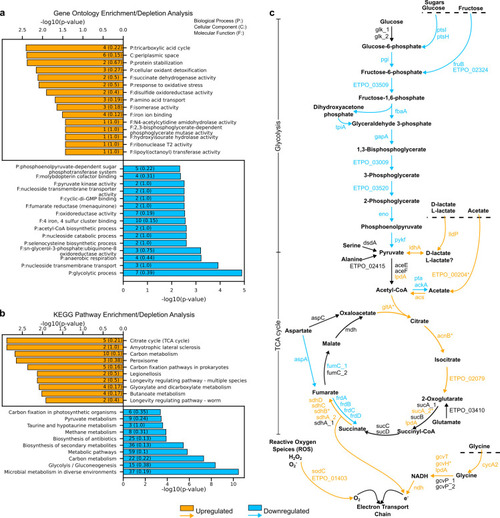
Bacterial sugar transport and glycolysis do not constitute the preferred carbon and energy source for E. piscicida during intracellular infection. (a and b) GO term (a) and KEGG pathway (b) enrichment analysis of DEGs in E. piscicida during intracellular infection of zebrafish fin fibroblasts. Orange and blue bars represent the -log10 P values for enriched annotations of upregulated and downregulated genes, respectively. The numbers on the bars represent the number of DEGs with the given annotation, and the numbers in parentheses represent the ratio of DEGs to all genes with the annotation. (c) Central carbon metabolism, metabolite transport, and energy generation pathways of E. piscicida during intracellular infection of zebrafish fibroblasts. Orange and blue arrows represent upregulated and downregulated processes, respectively. Black arrows represent unaltered processes. The genes involved with each process are labeled next to each arrow and are colored orange, blue, or black if they are significantly (FDR < 0.001) upregulated, significantly downregulated, or unaffected, respectively. DEGs with near significant (FDR < 0.05) changes in expression levels are marked with an asterisk. The corresponding arrow is colored if at least 60% of the genes involved with a process are differentially expressed. Black dotted lines represent bacterial membranes. All genes, gene products, and fold changes are listed in Table S7.

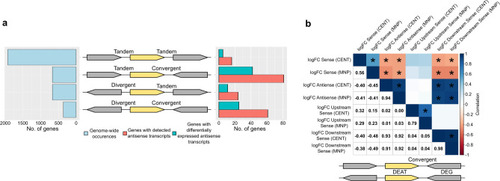
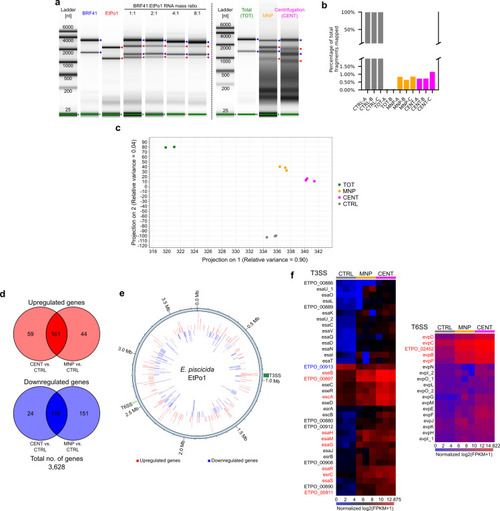
Orientational contexts of genes on the E. piscicida chromosome and correlation analysis of AT and ST fold changes of responder genes in convergent excludons (see text). (a) Orientational contexts for each gene and its upstream and downstream neighbors in the E. piscicida genome, and the number of genes with detectable antisense transcripts and differentially expressed antisense transcripts in each context. (b) For responder genes in convergent excludons, a correlation matrix of the Pearson’s correlations between fold changes of their sense, antisense, downstream counterparts’ sense, and upstream counterparts’ sense transcripts. Correlations are scaled to color and directly displayed in the upper and lower triangles, respectively. Significant correlations (P < 0.05) are marked by an asterisk in the upper triangle.

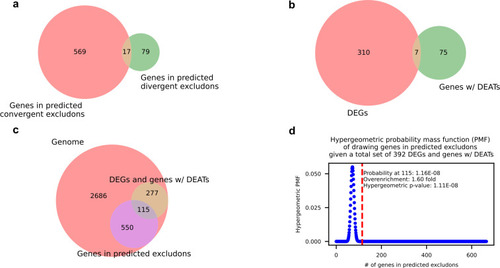
Genes in predicted excludons are enriched in the set of genes with perturbed expression during intracellular infection. (a) Venn diagram of the sets of genes in convergent and divergent excludons predicted by identification of RNA read fragments mapping across intergenic regions. (b) Venn diagram of the set of all genes with significantly perturbed expression during intracellular infection (the sets of DEGs and genes with DEATs). (c) Venn diagram of the set of all genes in predicted excludons and the set of all genes with significantly perturbed expression during intracellular infection in the E. piscicida genome. (d) Hypergeometric probability mass function of drawing any number of the 665 genes in predicted excludons from a total set of 392 genes with perturbed expression during intracellular infection. The dotted red line marks the PMF when 115 genes are drawn.

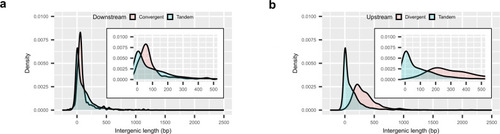
Intergenic distances between convergent and divergent gene pairs in the E. piscicida genome. (a and b) Density plot of downstream (a) and upstream (b) intergenic distances between gene pairs. Insets show the range from 0 to 500 bp.

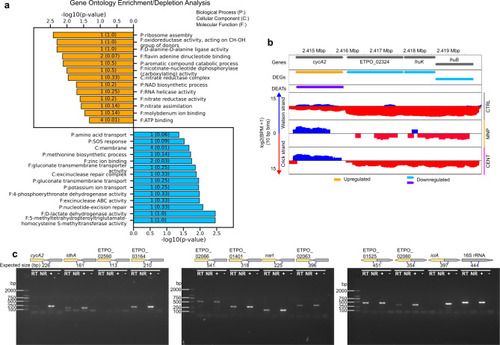
Potential roles and RT-PCR validation of predicted excludons. (a) GO enrichment analysis of responder genes in convergent excludons. Orange and blue bars represent enriched annotations for upregulated and downregulated antisense transcripts, respectively. Numbers on the bars represent the number of genes with the given annotation, and numbers in parentheses represent the ratio of genes to all genes with the annotation. (b) Representative responder gene in convergent excludon, cycA2, in a convergent gene pair with ETPO_02324. The first (upper) panel shows the positions and orientations of genes. The second panel shows DEGs: orange, upregulated; blue, downregulated. The third panel shows DEATs: purple, downregulated. The bottom three panels show the mean log2 fragments per bins per million mapped reads in 10 bp bins mapped to the Watson (blue) and Crick (red) strands in control bacterial RNAs (gray bar), MNP-enriched RNAs (orange bar), and centrifuge-enriched RNAs (pink bar). (c) RNA from broth-cultured bacteria was used for RT-PCR confirmation of overlapping transcription of predicted convergent and divergent excludons using primers designed within 100 bp upstream of the stop codons or 100 bp downstream of the start codons for convergent or divergent gene pairs, respectively. An internal fragment of the 16S rRNA gene was used as an RT control. Templates in PCR reaction: RT, RT reaction with enzyme; NR, RT reaction with no enzyme; +, 1 ng gDNA; and −, sterile water.

Acknowledgments
This image is the copyrighted work of the attributed author or publisher, and ZFIN has permission only to display this image to its users. Additional permissions should be obtained from the applicable author or publisher of the image. Full text @ MBio