IMAGE

Fig 5

ID
ZDB-IMAGE-240315-106
Source
Figures for Lanza et al., 2024
Image
Figure Caption

Fig 5

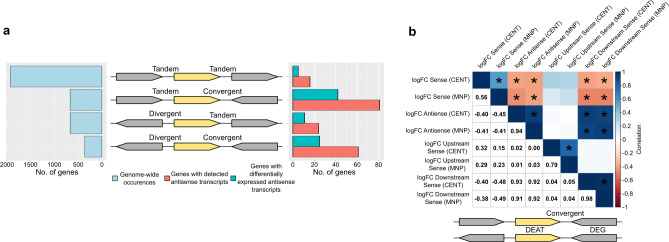
Orientational contexts of genes on the E. piscicida chromosome and correlation analysis of AT and ST fold changes of responder genes in convergent excludons (see text). (a) Orientational contexts for each gene and its upstream and downstream neighbors in the E. piscicida genome, and the number of genes with detectable antisense transcripts and differentially expressed antisense transcripts in each context. (b) For responder genes in convergent excludons, a correlation matrix of the Pearson’s correlations between fold changes of their sense, antisense, downstream counterparts’ sense, and upstream counterparts’ sense transcripts. Correlations are scaled to color and directly displayed in the upper and lower triangles, respectively. Significant correlations (P < 0.05) are marked by an asterisk in the upper triangle.

Acknowledgments
This image is the copyrighted work of the attributed author or publisher, and ZFIN has permission only to display this image to its users. Additional permissions should be obtained from the applicable author or publisher of the image. Full text @ MBio