IMAGE

Fig 4

ID
ZDB-IMAGE-240315-105
Source
Figures for Lanza et al., 2024
Image
Figure Caption

Fig 4

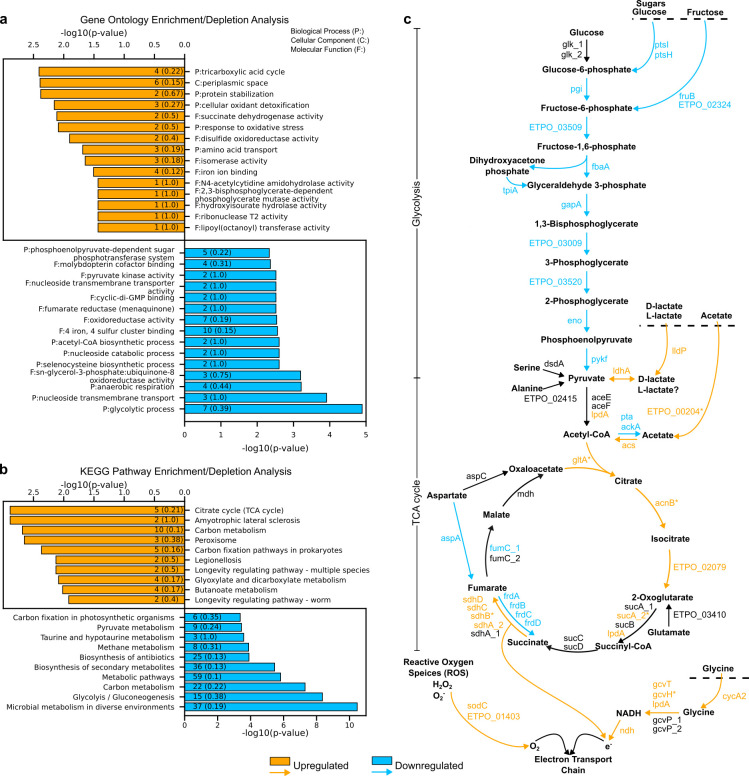
Bacterial sugar transport and glycolysis do not constitute the preferred carbon and energy source for E. piscicida during intracellular infection. (a and b) GO term (a) and KEGG pathway (b) enrichment analysis of DEGs in E. piscicida during intracellular infection of zebrafish fin fibroblasts. Orange and blue bars represent the -log10 P values for enriched annotations of upregulated and downregulated genes, respectively. The numbers on the bars represent the number of DEGs with the given annotation, and the numbers in parentheses represent the ratio of DEGs to all genes with the annotation. (c) Central carbon metabolism, metabolite transport, and energy generation pathways of E. piscicida during intracellular infection of zebrafish fibroblasts. Orange and blue arrows represent upregulated and downregulated processes, respectively. Black arrows represent unaltered processes. The genes involved with each process are labeled next to each arrow and are colored orange, blue, or black if they are significantly (FDR < 0.001) upregulated, significantly downregulated, or unaffected, respectively. DEGs with near significant (FDR < 0.05) changes in expression levels are marked with an asterisk. The corresponding arrow is colored if at least 60% of the genes involved with a process are differentially expressed. Black dotted lines represent bacterial membranes. All genes, gene products, and fold changes are listed in Table S7.

Acknowledgments
This image is the copyrighted work of the attributed author or publisher, and ZFIN has permission only to display this image to its users. Additional permissions should be obtained from the applicable author or publisher of the image. Full text @ MBio