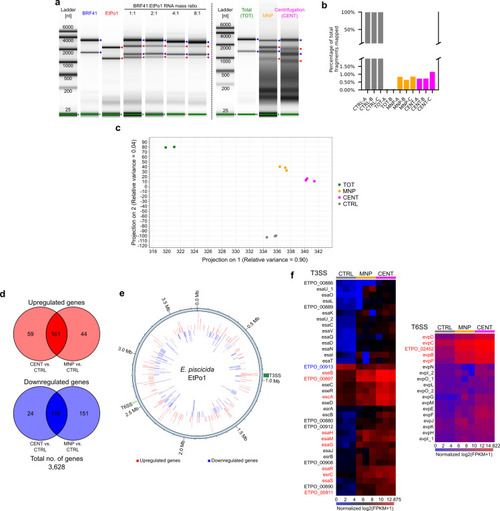
Enrichment of E. piscicida RNA from infected zebrafish fibroblasts allows comprehensive analysis of gene expression. (a) Electropherogram of pure E. piscicida (EtPo1) and zebrafish fibroblast (BRF41) RNA and mock mixed RNA at host:bacteria mass ratios of 1:1, 2:1, 4:1, and 8:1 (left panel). Representative electropherogram of RNA extracted from infected BRF41 cells by different methods (right panel): TOT, total RNA extraction; MNP, MNP enrichment method; and CENT, centrifugation enrichment method. The left and right panel electropherograms were obtained from running samples on an Agilent RNA ScreenTape and a High Sensitivity RNA ScreenTape, respectively. Electropherogram lanes are scaled to the highest intensity peak. Blue and red arrows next to the electropherograms represent host and bacterial ribosomal RNAs, respectively. (b) Percentage of total fragments mapped to the E. piscicida EtPo1 genome in enriched (MNP, CENT) and non-enriched (TOT) RNAs from infected BRF41 cells, and from control, broth-cultured bacteria (CTRL). (c) Principal component analysis of gene expression data in enriched (MNP, CENT), non-enriched (TOT), and control, broth-cultured (CTRL) E. piscicida RNAs. (d) Number of common DEGs (FDR < 0.001) between the MNP-enriched RNAs and centrifugation-enriched RNAs. (e) Map of the E. piscicida EtPo1 genome (light blue ring) showing the locations of all upregulated (red bars) and downregulated (blue bars) genes. The T3SS and T6SS loci are highlighted as green and light green bars, respectively, in the outer ring. (f) Heatmap of the normalized fragments per kilobase million (FPKM) expression values of genes in the T3SS (left) and T6SS (right) loci. Upregulated and downregulated genes are colored red and blue, respectively.
|
