IMAGE

Fig 6

ID
ZDB-IMAGE-240315-107
Source
Figures for Lanza et al., 2024
Image
Figure Caption

Fig 6

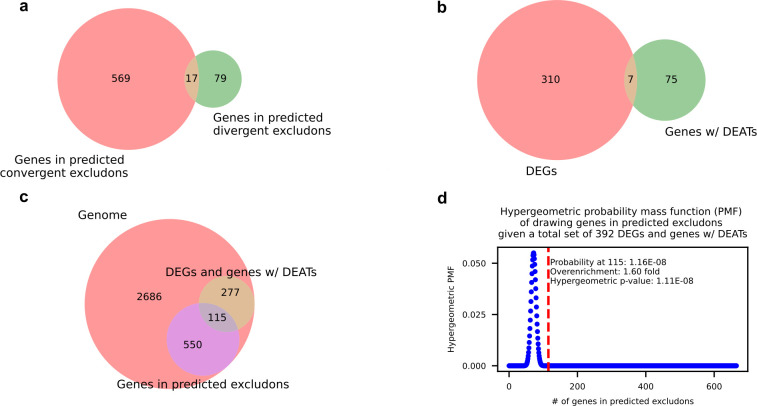
Genes in predicted excludons are enriched in the set of genes with perturbed expression during intracellular infection. (a) Venn diagram of the sets of genes in convergent and divergent excludons predicted by identification of RNA read fragments mapping across intergenic regions. (b) Venn diagram of the set of all genes with significantly perturbed expression during intracellular infection (the sets of DEGs and genes with DEATs). (c) Venn diagram of the set of all genes in predicted excludons and the set of all genes with significantly perturbed expression during intracellular infection in the E. piscicida genome. (d) Hypergeometric probability mass function of drawing any number of the 665 genes in predicted excludons from a total set of 392 genes with perturbed expression during intracellular infection. The dotted red line marks the PMF when 115 genes are drawn.

Acknowledgments
This image is the copyrighted work of the attributed author or publisher, and ZFIN has permission only to display this image to its users. Additional permissions should be obtained from the applicable author or publisher of the image. Full text @ MBio