
|
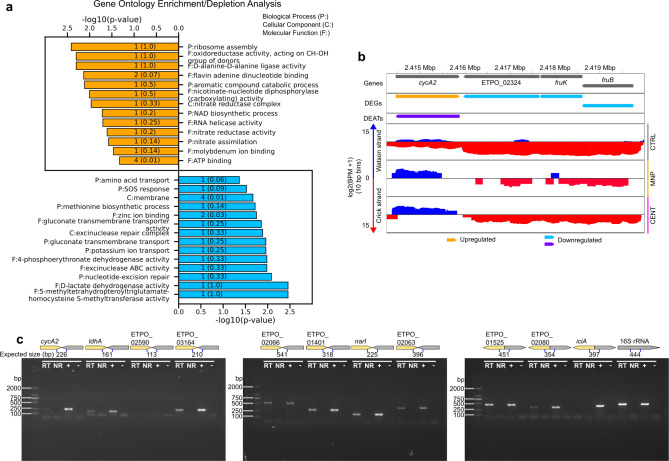
Fig 8
Potential roles and RT-PCR validation of predicted excludons. (a) GO enrichment analysis of responder genes in convergent excludons. Orange and blue bars represent enriched annotations for upregulated and downregulated antisense transcripts, respectively. Numbers on the bars represent the number of genes with the given annotation, and numbers in parentheses represent the ratio of genes to all genes with the annotation. (b) Representative responder gene in convergent excludon,