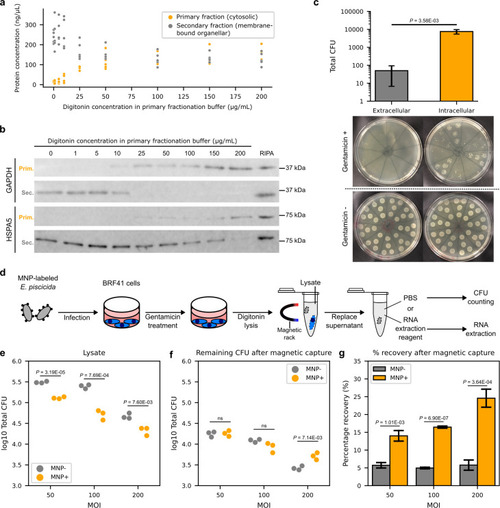
MNP-labeled E. piscicida can be magnetically separated from zebrafish fibroblast lysates. (a) Protein concentrations in the subcellular fractions of sequentially fractionated zebrafish fibroblasts primarily lysed with varying concentrations of digitonin. (b) Western blot of cytosolic glyceraldehyde-3-phosphate dehydrogenase, GAPDH, and the ER lumen protein, HSPA5/BiP, in the primary (Prim.) and secondary (Sec.) subcellular fractions of zebrafish fibroblasts primarily lysed with varying concentrations of digitonin. Whole-cell lysates in RIPA buffer were loaded as a control. (c) Total colony-forming unit (CFU) in the cell culture medium (extracellular) and lysates (intracellular) of zebrafish fibroblasts infected with E. piscicida at a multiplicity of infection (MOI) of 50 and treated with gentamicin for 3 h. The extracellular and intracellular CFU in non-treated cells (Gentamicin−) were innumerable at the same dilutions used to count CFUs from treated cells (Gentamicin+). (d) Schematic showing the procedure of infecting zebrafish fibroblasts with MNP-labeled E. piscicida and their subsequent separation from host lysates by a magnetic rack for CFU counting or RNA extraction. (e) Log10 total CFU in the lysates of zebrafish fibroblasts infected with MNP-labeled (MNP+) or unlabeled (MNP−) E. piscicida at MOIs of 50, 100, or 200. (f) Remaining CFU after magnetic capture of lysates in panel e. (g) Percentage of recovery of CFU after magnetic capture of lysates from panels e and f. Data points in panel a are from five independent experiments. Data points in panels e and f are from three biological replicates. Shown in panels c and g are the mean ± s.d. of three biological replicates. Data were analyzed using two-tailed unpaired Student’s t-test (c, e–g). P < 0.05 are displayed and otherwise marked as ns.
|
