N,N,N′,N′‐tetrakis(2‐pyridylmethyl)ethylenediamine (TPEN)‐induced P53‐dependent hematopoietic defects in zebrafish: (A) timeline of TPEN modeling and observation time points for all hematopoietic lineages; (B) representative images of hematopoietic stem cells (HSCs) in control and TPEN (150 μM)‐treated Tg(runx1: eGFP) embryos with or without zinc incubation (100 μM) for 12 h. The quantitative results are shown in the right panel; (C) whole in situ hybridization showing the transcriptional expression of cmyb. The numbers at the top‐right corner show the number of embryos with representative phenotypes/the total number of embryos in the group. Positive stained cells are pointed by a black arrowhead in the zoomed inset. (D and E) Representative images of neutrophils in Tg(lyz:eGFP) embryos (D) and macrophages in Tg(mpeg:eGFP) embryos (E). The quantitative results are shown in the right panels; (F) representative images of red blood cells in Tg(LCR:eGFP) embryos at 3 and 4.5 dpf, respectively; (G) Western blot images and quantitative results showing P53 expression; (H) representative images and quantitative results showing the effect of tp53 morpholino microinjection on TPEN‐induced HSCs reduction compared to that of standard control morpholino; (I and J) immunostaining of H2AX‐labeled apoptotic cells (red signals in I) and PH3‐labeled of proliferating cells (red signals in J) in HSCs labeled (green signals) Tg(runx1: eGFP) zebrafish with different treatments. At least 7 embryos were included in each group; for Western blot experiments, 30 embryos in each group from three separate experiments were used; arrowheads in (B–F, H) pointed to the positive stained cell signals; scale bar (in B, D–F, H), 200 μm; scale bar (in C), 500 μm; scale bar (in I–J), 100 μm. hpf, hours post fertilization. *p < 0.05; **p < 0.01.

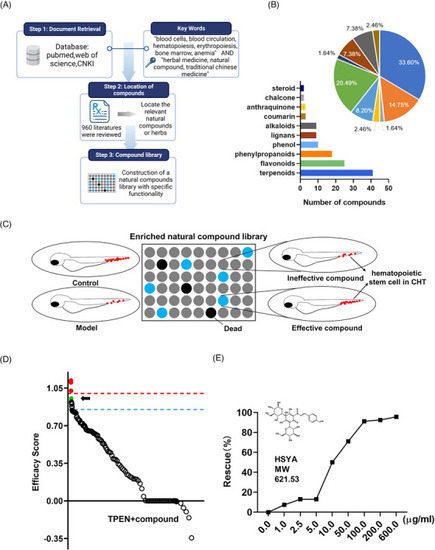
Phenotypic screening for hematopoietic‐protective compounds in N,N,N′,N′‐tetrakis(2‐pyridylmethyl)ethylenediamine (TPEN)‐treated zebrafish: (A) construction of an enriched library of natural compounds related to blood diseases; (B) chemical profile of the enriched natural compound library; (C) schematic diagram of phenotypic screening. The number of hematopoietic stem cells (HSCs) (represented by red dots) in the caudal hematopoietic tissue of zebrafish was used as a screening indicator; (D) the scatter plot summarizes the effect of all compounds on the number of HSCs. Efficacy score was calculated by (NdrugNmodel)/(NcontrolNmodel). The blue dashed line represented the efficacy score of 0.85 and the red dashed line marked the efficacy score of 1.0. Hydroxysafflor yellow A (HSYA) is marked as a green dot and indicated by a black arrow. Compounds that increased the number of HSCs to a higher than normal level are marked as red dots; (E) rescue effects on HSCs with gradient treatment of HSYA in TPEN‐treated zebrafish.

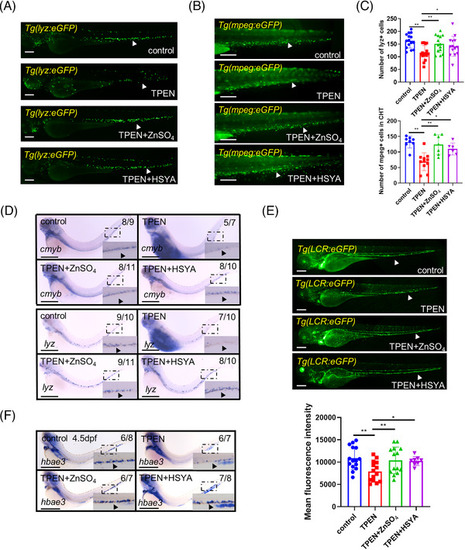
Regulation of downstream hematopoietic lineages by hydroxysafflor yellow A (HSYA) in N,N,N′,N′‐tetrakis(2‐pyridylmethyl)ethylenediamine (TPEN)‐treated zebrafish: (A and B) representative images showing neutrophils in Tg(lyz:eGFP) embryos (A) and macrophages in Tg(mpeg:eGFP) embryos (B) in control and TPEN (150 μM)‐treated embryos with or without incubation of ZnSO4 (100 μM) or HSYA (100 μg/ml); (C) quantitative result of neutrophils and macrophages; (D) whole in situ hybridization showing the transcriptional expression of cmyb and lyz in zebrafish embryos; (E) representative fluorescence images and quantitative results of red blood cells in Tg(LCR:eGFP) embryos on 4.5 dpf; (F) whole in situ hybridization showing the transcriptional expression of hbae3 in zebrafish embryos. The numbers at the top‐right corner of (D–F) show the number of embryos with representative phenotypes/the total number of embryos in the group. Positive stained cells are pointed by a black arrowhead in the zoomed insets of (D) and (F). At least 7 embryos were included in each group; Scale bar (in A, B, and E), 200 μm; scale bar (in D and F), 500 μm. hpf, hours post fertilization. *p < 0.05; **p < 0.01.

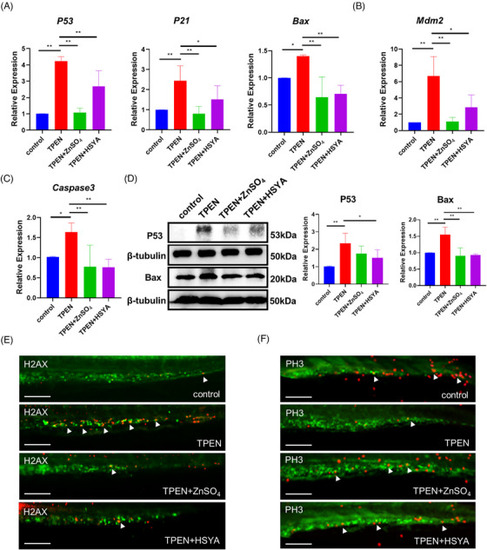
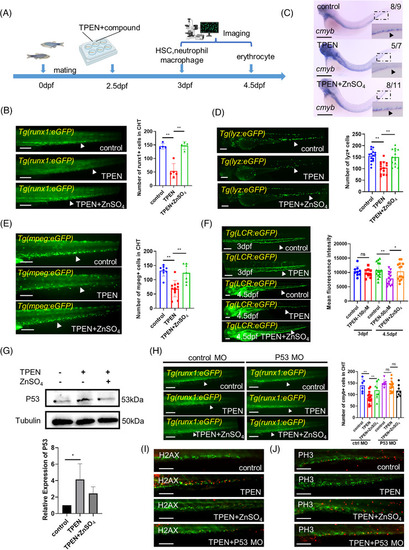
Hydroxysafflor yellow A (HSYA) downregulated P53 signaling and cell apoptosis in N,N,N′,N′‐tetrakis(2‐pyridylmethyl)ethylenediamine (TPEN)‐treated zebrafish. (A) QPCR results showing the expression of P53 and its downstream proapoptotic factors P21 and Bax in zebrafish embryos with indicated treatment for 12 h; TPEN:150 μM, ZnSO4:100 μM, HSYA:100 μg/ml. (B and C) QPCR results showing the expression of Mdm2 (B) and Caspase3 (C); (D) Western blot images and quantitative results showing P53 and Bax expression; (E and F) immunostaining of H2AX‐labeled apoptotic cells (red signals in E) and PH3‐labeled of proliferating cells (red signals in F) in TPEN‐treated Tg(runx1: eGFP) zebrafish with hematopoietic stem cells (HSCs) labeled in green; at least 7 embryos were included in each group; For Western blot and QPCR experiments, 30 embryos in each group from 3 separate experiments were used; scale bar (in E and F), 100 μm. *p < 0.05; **p < 0.01.

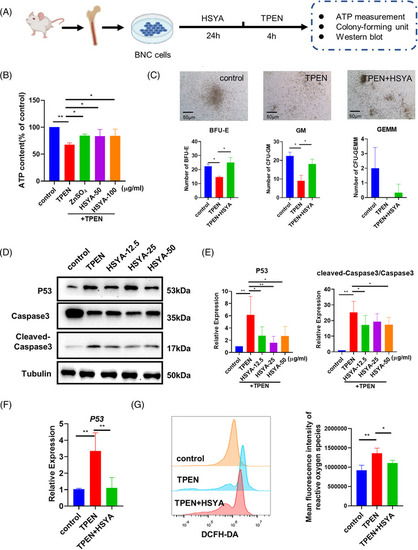
Hematopoietic‐promoting activity of hydroxysafflor yellow A (HSYA) on mice bone marrow nucleated cells: (A) experimental protocol of bone marrow nucleated cells (BNCs) extraction and drug treatment; (B) ATP content of control and N,N,N′,N′‐tetrakis(2‐pyridylmethyl)ethylenediamine (TPEN)‐treated BNCs with or without HSYA pretreatment; (C) representative images and quantitative result of hematopoietic colony‐forming unit (CFU) assay. (D and E) Western blot images and quantitative results showing P53 and cleaved‐Caspase3/Caspase3 expression of control and TPEN‐treated BNCs with or without different dosages of HSYA; (F) QPCR results showing the expression of P53 in BNCs with indicated treatment; (G) fluorescence intensity and quantitative result of reactive oxygen species detected by flow cytometry. The dosage of TPEN is 7.5 μM in all groups; the dosages of HSYA are 50 μg/ml in (C) and 12.5 μg/ml in (F and G), and as listed in (B) and (D). BFU‐E, burst‐forming unit‐erythroid; GM, granulocyte–monocyte; GEMM, granulocyte‐erythrocyte‐macrophage‐megakaryocyte. Scale bar in (C), 50 μm; *p < 0.05; **p < 0.01.

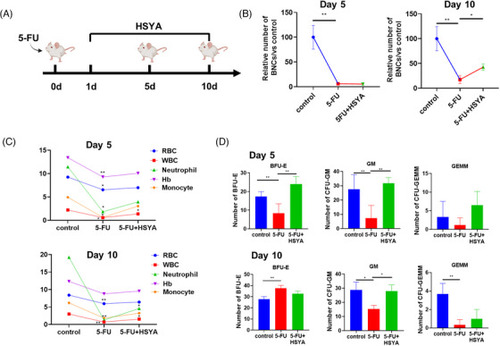
Hydroxysafflor yellow A (HSYA) partially rescues hematopoietic defects in 5‐FU‐induced myelosuppression mice: (A) timeline of 5‐FU modeling and drug administration; (B) the number of bone marrow nucleated cells (BNCs) in the 5‐FU‐treated mice with or without HSYA administration on days 5 and 10. Each group had five mice; (C) peripheral blood analysis on days 5 and 10. Each group consisted of 3–5 mice; (D) quantitative result of hematopoietic colony‐forming unit (CFU) assay. *p < 0.05; **p < 0.01.

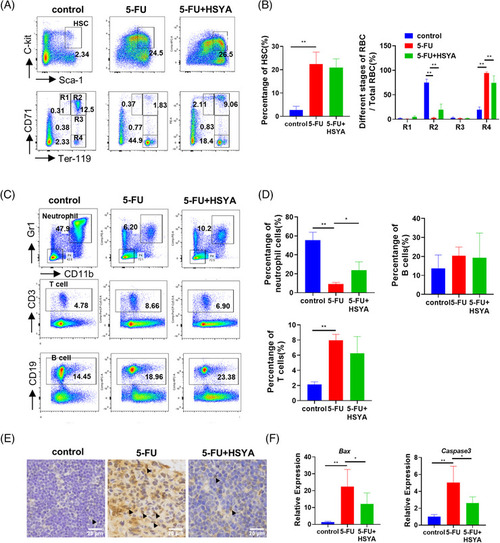
Hydroxysafflor yellow A (HSYA) partially repairs hematopoietic defects in 5‐FU‐treated mice: (A) flow cytometry in different treatment groups to detect the proportion of hematopoietic stem cells and the distribution of erythrocytes at different stages on day 10. LSK cells/hematopoietic stem cells (HSCs) (Lin‐Sca‐1+c‐kit+); proerythroblast/R1 (CD71highTer119intermediate); basophilic erythroblast (CD71highTer119high); polychromatic erythroblast (CD71intermediateTer119high); orthochromatic erythroblast (CD71lowTer119high); 5‐FU, 200 mg/kg; HSYA, 100 mg/kg; (B) quantitative result of flow cytometry; (C) flow cytometry to detect the proportion of neutrophils, T cells and B cells on day 10. Neutrophil (CD11b+Gr1+); T lymphocyte (CD3+); B lymphocyte (CD19+); (D) quantitative result of (C) for flow cytometry; three mice in each group for flow cytometry; (E) immunohistochemical staining of P53 in mouse thymus tissue. Arrowheads pointed to P53‐stained cells. Scale bar: 20 μm; (F) QPCR results showing the expression of Bax and Caspase3 in different mice treatment groups. *p < 0.05; **p < 0.01.

Acknowledgments
This image is the copyrighted work of the attributed author or publisher, and ZFIN has permission only to display this image to its users. Additional permissions should be obtained from the applicable author or publisher of the image. Full text @ MedComm (Beijing)