FIGURE

FIGURE 2

ID
ZDB-FIG-230828-130
Publication
Chen et al., 2023 - Identification of the natural chalcone glycoside hydroxysafflor yellow A as a suppressor of P53 overactivation-associated hematopoietic defects
Other Figures
All Figure Page
Back to All Figure Page
FIGURE 2

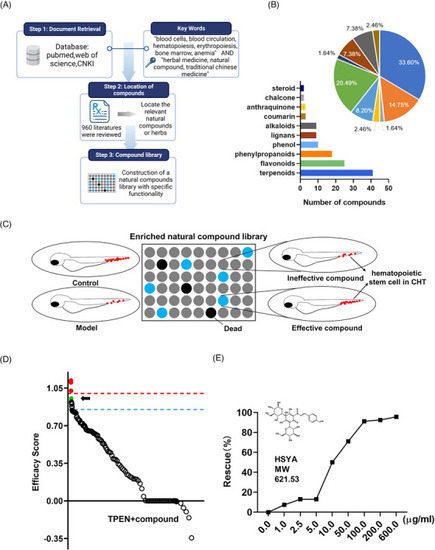
Phenotypic screening for hematopoietic‐protective compounds in N,N,N′,N′‐tetrakis(2‐pyridylmethyl)ethylenediamine (TPEN)‐treated zebrafish: (A) construction of an enriched library of natural compounds related to blood diseases; (B) chemical profile of the enriched natural compound library; (C) schematic diagram of phenotypic screening. The number of hematopoietic stem cells (HSCs) (represented by red dots) in the caudal hematopoietic tissue of zebrafish was used as a screening indicator; (D) the scatter plot summarizes the effect of all compounds on the number of HSCs. Efficacy score was calculated by (NdrugNmodel)/(NcontrolNmodel). The blue dashed line represented the efficacy score of 0.85 and the red dashed line marked the efficacy score of 1.0. Hydroxysafflor yellow A (HSYA) is marked as a green dot and indicated by a black arrow. Compounds that increased the number of HSCs to a higher than normal level are marked as red dots; (E) rescue effects on HSCs with gradient treatment of HSYA in TPEN‐treated zebrafish.

Expression Data

Expression Detail
Antibody Labeling
Phenotype Data

Phenotype Detail
Acknowledgments
This image is the copyrighted work of the attributed author or publisher, and ZFIN has permission only to display this image to its users. Additional permissions should be obtained from the applicable author or publisher of the image. Full text @ MedComm (Beijing)