IMAGE

FIGURE 5

ID
ZDB-IMAGE-230828-134
Source
Figures for Chen et al., 2023
Image
Figure Caption

FIGURE 5

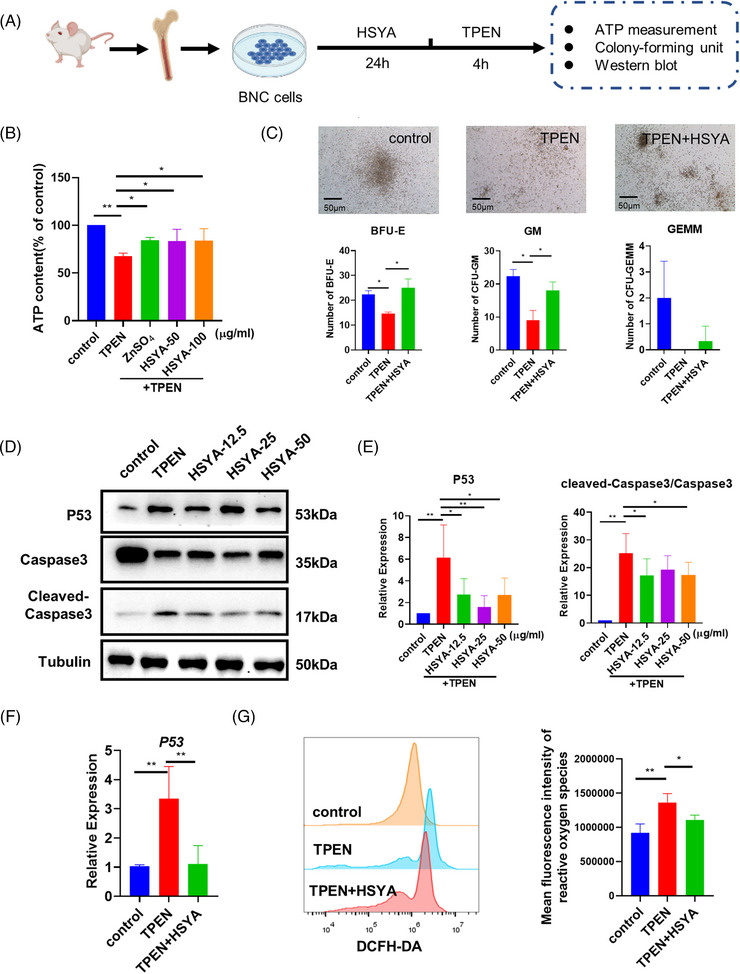
Hematopoietic‐promoting activity of hydroxysafflor yellow A (HSYA) on mice bone marrow nucleated cells: (A) experimental protocol of bone marrow nucleated cells (BNCs) extraction and drug treatment; (B) ATP content of control and N,N,N′,N′‐tetrakis(2‐pyridylmethyl)ethylenediamine (TPEN)‐treated BNCs with or without HSYA pretreatment; (C) representative images and quantitative result of hematopoietic colony‐forming unit (CFU) assay. (D and E) Western blot images and quantitative results showing P53 and cleaved‐Caspase3/Caspase3 expression of control and TPEN‐treated BNCs with or without different dosages of HSYA; (F) QPCR results showing the expression of P53 in BNCs with indicated treatment; (G) fluorescence intensity and quantitative result of reactive oxygen species detected by flow cytometry. The dosage of TPEN is 7.5 μM in all groups; the dosages of HSYA are 50 μg/ml in (C) and 12.5 μg/ml in (F and G), and as listed in (B) and (D). BFU‐E, burst‐forming unit‐erythroid; GM, granulocyte–monocyte; GEMM, granulocyte‐erythrocyte‐macrophage‐megakaryocyte. Scale bar in (C), 50 μm; *p < 0.05; **p < 0.01.

Acknowledgments
This image is the copyrighted work of the attributed author or publisher, and ZFIN has permission only to display this image to its users. Additional permissions should be obtained from the applicable author or publisher of the image. Full text @ MedComm (Beijing)