IMAGE

FIGURE 3

ID
ZDB-IMAGE-230828-132
Source
Figures for Chen et al., 2023
Image
Figure Caption

FIGURE 3

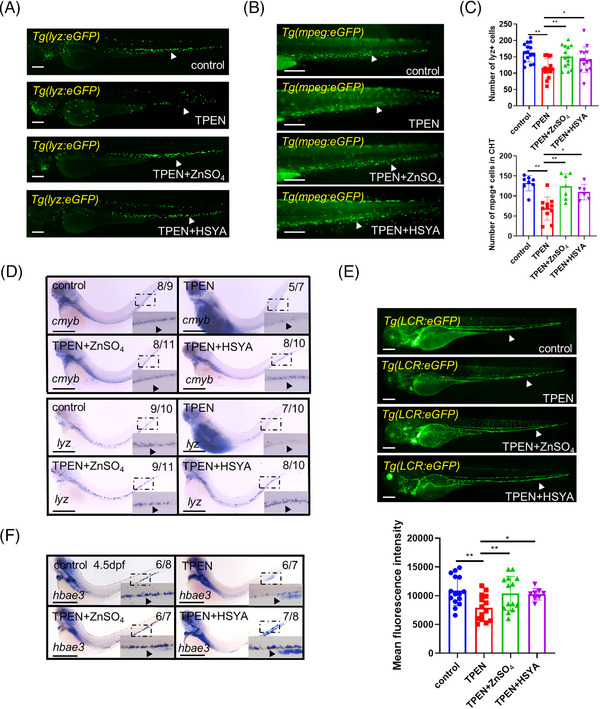
Regulation of downstream hematopoietic lineages by hydroxysafflor yellow A (HSYA) in N,N,N′,N′‐tetrakis(2‐pyridylmethyl)ethylenediamine (TPEN)‐treated zebrafish: (A and B) representative images showing neutrophils in Tg(lyz:eGFP) embryos (A) and macrophages in Tg(mpeg:eGFP) embryos (B) in control and TPEN (150 μM)‐treated embryos with or without incubation of ZnSO4 (100 μM) or HSYA (100 μg/ml); (C) quantitative result of neutrophils and macrophages; (D) whole in situ hybridization showing the transcriptional expression of cmyb and lyz in zebrafish embryos; (E) representative fluorescence images and quantitative results of red blood cells in Tg(LCR:eGFP) embryos on 4.5 dpf; (F) whole in situ hybridization showing the transcriptional expression of hbae3 in zebrafish embryos. The numbers at the top‐right corner of (D–F) show the number of embryos with representative phenotypes/the total number of embryos in the group. Positive stained cells are pointed by a black arrowhead in the zoomed insets of (D) and (F). At least 7 embryos were included in each group; Scale bar (in A, B, and E), 200 μm; scale bar (in D and F), 500 μm. hpf, hours post fertilization. *p < 0.05; **p < 0.01.

Acknowledgments
This image is the copyrighted work of the attributed author or publisher, and ZFIN has permission only to display this image to its users. Additional permissions should be obtained from the applicable author or publisher of the image. Full text @ MedComm (Beijing)