
- Title
-
Ventricular Anisotropic Deformation and Contractile Function of the Developing Heart of Zebrafish in-vivo
- Authors
- Salehin, N., Teranikar, T., Lee, J., Chuong, C.J.
- Source
- Full text @ Dev. Dyn.
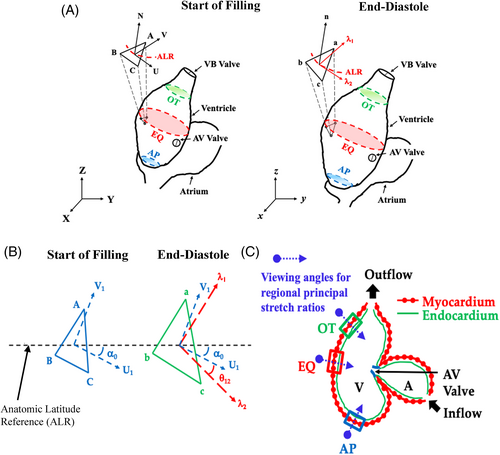
Regional deformation is calculated from the relative movements of three myocyte nuclear markers confining the region ABC. (A) Triangular region ABC represents the reference configuration at the start of filling (the end of isovolumic relaxation) where UVN denotes the local coordinates. Triangular region abc represents its deformed configuration at end-diastole. ALR, anatomical latitude reference line; λ1, λ2, principal stretches. Three regions were analyzed: outflow (OT), equatorial (EQ), and apex (AP). (B) Principal directions were resolved in angles (°) from ALR, where α02 (= α0 + θ12): angle of λ2 from ALR at end-diastole, α0, angle between U1 and ALR at the start of filling, and θ12: angle of λ2 from U1 at end-diastole. (C) two-dimensional (2D) projection of the zebrafish heart showing the examined OT, EQ, and AP regions |

Representative selective plane illumination microscopy (SPIM) images of 4-dpf Tg (cmlc2: eGFP − nuc) zebrafish heart showing ventricular cardiomyocyte nuclei: (A) at the start of filling (end of isovolumic relaxation), (B) at end-diastole (ED or the end of filling). Nuclei used as deformation analysis markers are indicated in red, and yellow arrows indicate the inflow through atrio-ventricular (AV) valve and the outflow through ventriculo-bulbar (VB) valve, V denotes ventricle. (C) A plane cut through the equatorial (EQ) region of the ventricle at ED state to reveal the transverse cross-section of the ventricular wall as a single-cell myocardial wall shown in (D) |
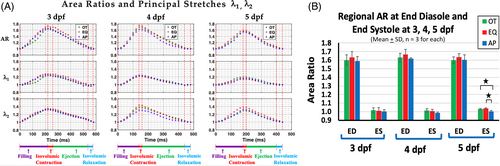
(A) Representative time courses for area ratio (AR) and principal stretches: λ1, λ2 for one cardiac cycle at the outflow (OT), equatorial (EQ), and apex (AP) regions. The four cardiac cycle phases are indicated with red vertical dashed lines. (B) Area ratio (AR) at end-diastole (ED) and end-systole (ES) during a cardiac cycle. No statistically significant differences were found among regions and in different dpf groups, except between AP vs EQ and AP vs OT in the 5-dpf group. Statistically significant differences (P < 0.05) are denoted by asterisk |
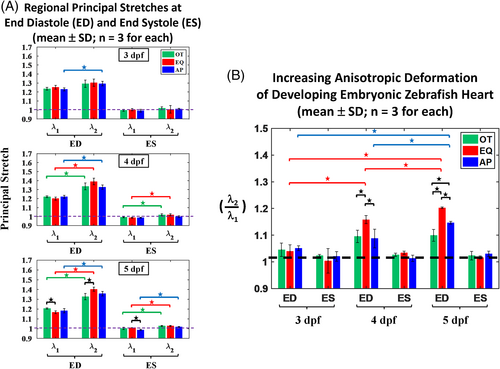
(A) Regional principal stretches λ1, λ2 at end-diastole (ED) and end-systole (ES) during a cardiac cycle at the outflow (OT), equatorial (EQ), and apex (AP) regions of developing zebrafish heart at 3-, 4-, and 5-dpf where λ2 denote principal stretches near the latitudinal direction and λ1 denote that at the direction perpendicular from the former. From 4-, 5-dpf groups, at ED, we noted greater deformation (designated as λ2) at the direction near the ALR in each of OT, EQ, and AP regions. Same were found at ES state indicating their anisotropic deformation, except in AP from 4-dpf. From 3-dpf group, we noted only slightly anisotropic with significantly higher λ2 at AP region. Statistically significant differences (P < 0.05) are denoted by asterisk. (B) Ratios of principal stretch components (λ2/λ1) at ED and ES states from outflow (OT), equatorial (EQ), and apex (AP) regions. Statistically significant differences (P < 0.05) are denoted by asterisk |
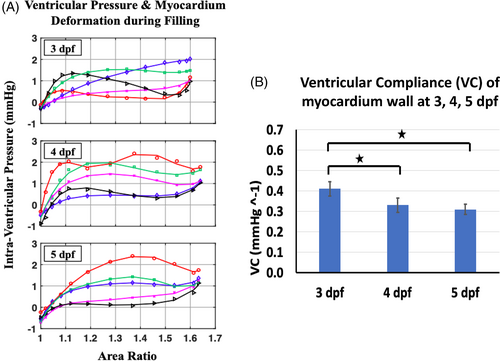
Passive response of the ventricular myocardium during the filling phase from 3-, 4- and 5-dpf groups. (A) Increasing intraventricular pressure IVP (n = 5) vs averaged AR (regional average at each dpf group) during ventricular filling. In each dpf group, individual curves are IVP measurements from each of zebrafish (n = 5). (B) Decreasing ventricular wall compliance (VC) of the developing heart indicates higher ventricular wall stiffness at 4- and 5- than 3-dpf group (P < 0.05 as denoted by asterisk) |
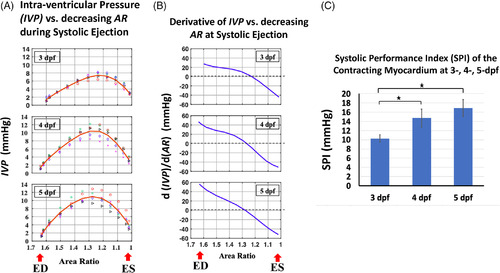
Active contractile response of the ventricular. (A) Generation of intraventricular pressure (IVP) with decreasing averaged AR for each dpf during the ejection phase of a cardiac cycle. Sets of colored symbols within each dpf group represent IVP measurements from different zebrafish, and the solid red line is the fitted characteristic IVP (Table 2) for each dpf group (n = 5 in each). (B) Increasing pressure generation intensity during ejection, calculated as the derivative of the characteristic IVP with respect to AR. (C) Higher systolic performance index (SPI) of the contracting myocardium during ejection were found from 4- and 5- than 3-dpf group (P < 0.05 as denoted by asterisk) |
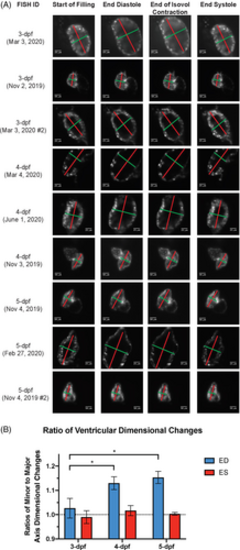
(A) The major (red line) and minor axis (green line) lengths of the embryonic heart ventricle were measured at the start of filling, the end-diastole (ED), the end of isovolumic contraction and the end-systole (ES) state. (B) Changes in the major and minor axis dimension of the ventricular chamber at ED and ES states during a cardiac cycle were expressed as ratios for the ED and ES states, using the corresponding dimension at the start of filling as reference. This ratio for the ED state was significantly higher for the 4- and 5-dpf groups than for the 3-dpf group. Statistically significant differences (P < 0.05) are denoted by asterisk |
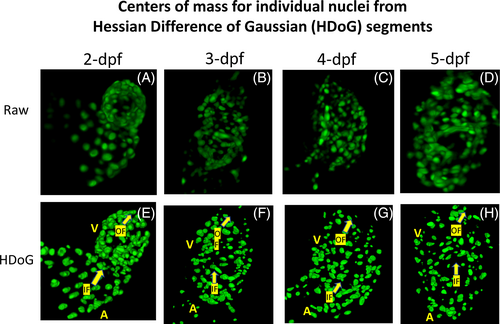
Visualizing spatiotemporal dynamics of myocardial cardiomyocyte nuclei from zebrafish at 2, 3, 4, 5 dpf. (A, B, C, D) Volumetric reconstruction of myocardial cardiomyocyte architecture acquired using high magnification water objective lens, enabling higher spatial resolution albeit with tradeoff in field of view. (E, F, G, H) Segmented nuclei volumes using Hessian Difference of Gaussian (HDoG) filter in conjunction with watershed algorithm. A, atrium, IF: inflow through AV valve, OF: outflow through VB valve; V, ventricle. Arrow heads point to the direction of the flow |