
|
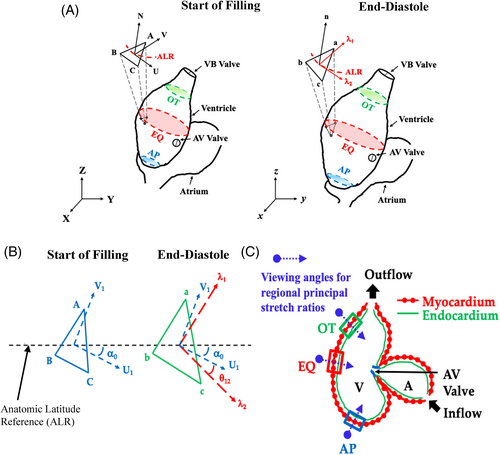
Fig. 1 Regional deformation is calculated from the relative movements of three myocyte nuclear markers confining the region ABC. (A) Triangular region ABC represents the reference configuration at the start of filling (the end of isovolumic relaxation) where UVN denotes the local coordinates. Triangular region abc represents its deformed configuration at end-diastole. ALR, anatomical latitude reference line; λ1, λ2, principal stretches. Three regions were analyzed: outflow (OT), equatorial (EQ), and apex (AP). (B) Principal directions were resolved in angles (°) from ALR, where α02 (= α0 + θ12): angle of λ2 from ALR at end-diastole, α0, angle between U1 and ALR at the start of filling, and θ12: angle of λ2 from U1 at end-diastole. (C) two-dimensional (2D) projection of the zebrafish heart showing the examined OT, EQ, and AP regions