
Image
|
Figure Caption
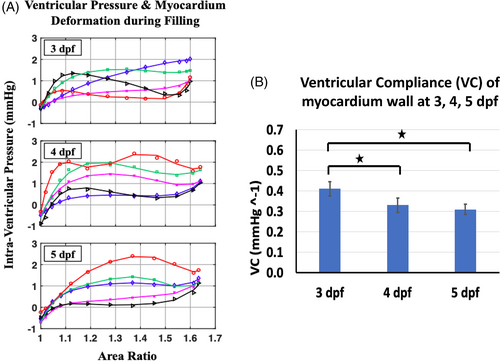
Fig. 5 Passive response of the ventricular myocardium during the filling phase from 3-, 4- and 5-dpf groups. (A) Increasing intraventricular pressure IVP (n = 5) vs averaged AR (regional average at each dpf group) during ventricular filling. In each dpf group, individual curves are IVP measurements from each of zebrafish (n = 5). (B) Decreasing ventricular wall compliance (VC) of the developing heart indicates higher ventricular wall stiffness at 4- and 5- than 3-dpf group (P < 0.05 as denoted by asterisk)
Acknowledgments
This image is the copyrighted work of the attributed author or publisher, and
ZFIN has permission only to display this image to its users.
Additional permissions should be obtained from the applicable author or publisher of the image.
Full text @ Dev. Dyn.