
|
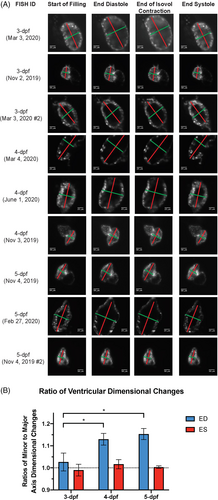
Fig. 7 (A) The major (red line) and minor axis (green line) lengths of the embryonic heart ventricle were measured at the start of filling, the end-diastole (ED), the end of isovolumic contraction and the end-systole (ES) state. (B) Changes in the major and minor axis dimension of the ventricular chamber at ED and ES states during a cardiac cycle were expressed as ratios for the ED and ES states, using the corresponding dimension at the start of filling as reference. This ratio for the ED state was significantly higher for the 4- and 5-dpf groups than for the 3-dpf group. Statistically significant differences (P < 0.05) are denoted by asterisk