
|
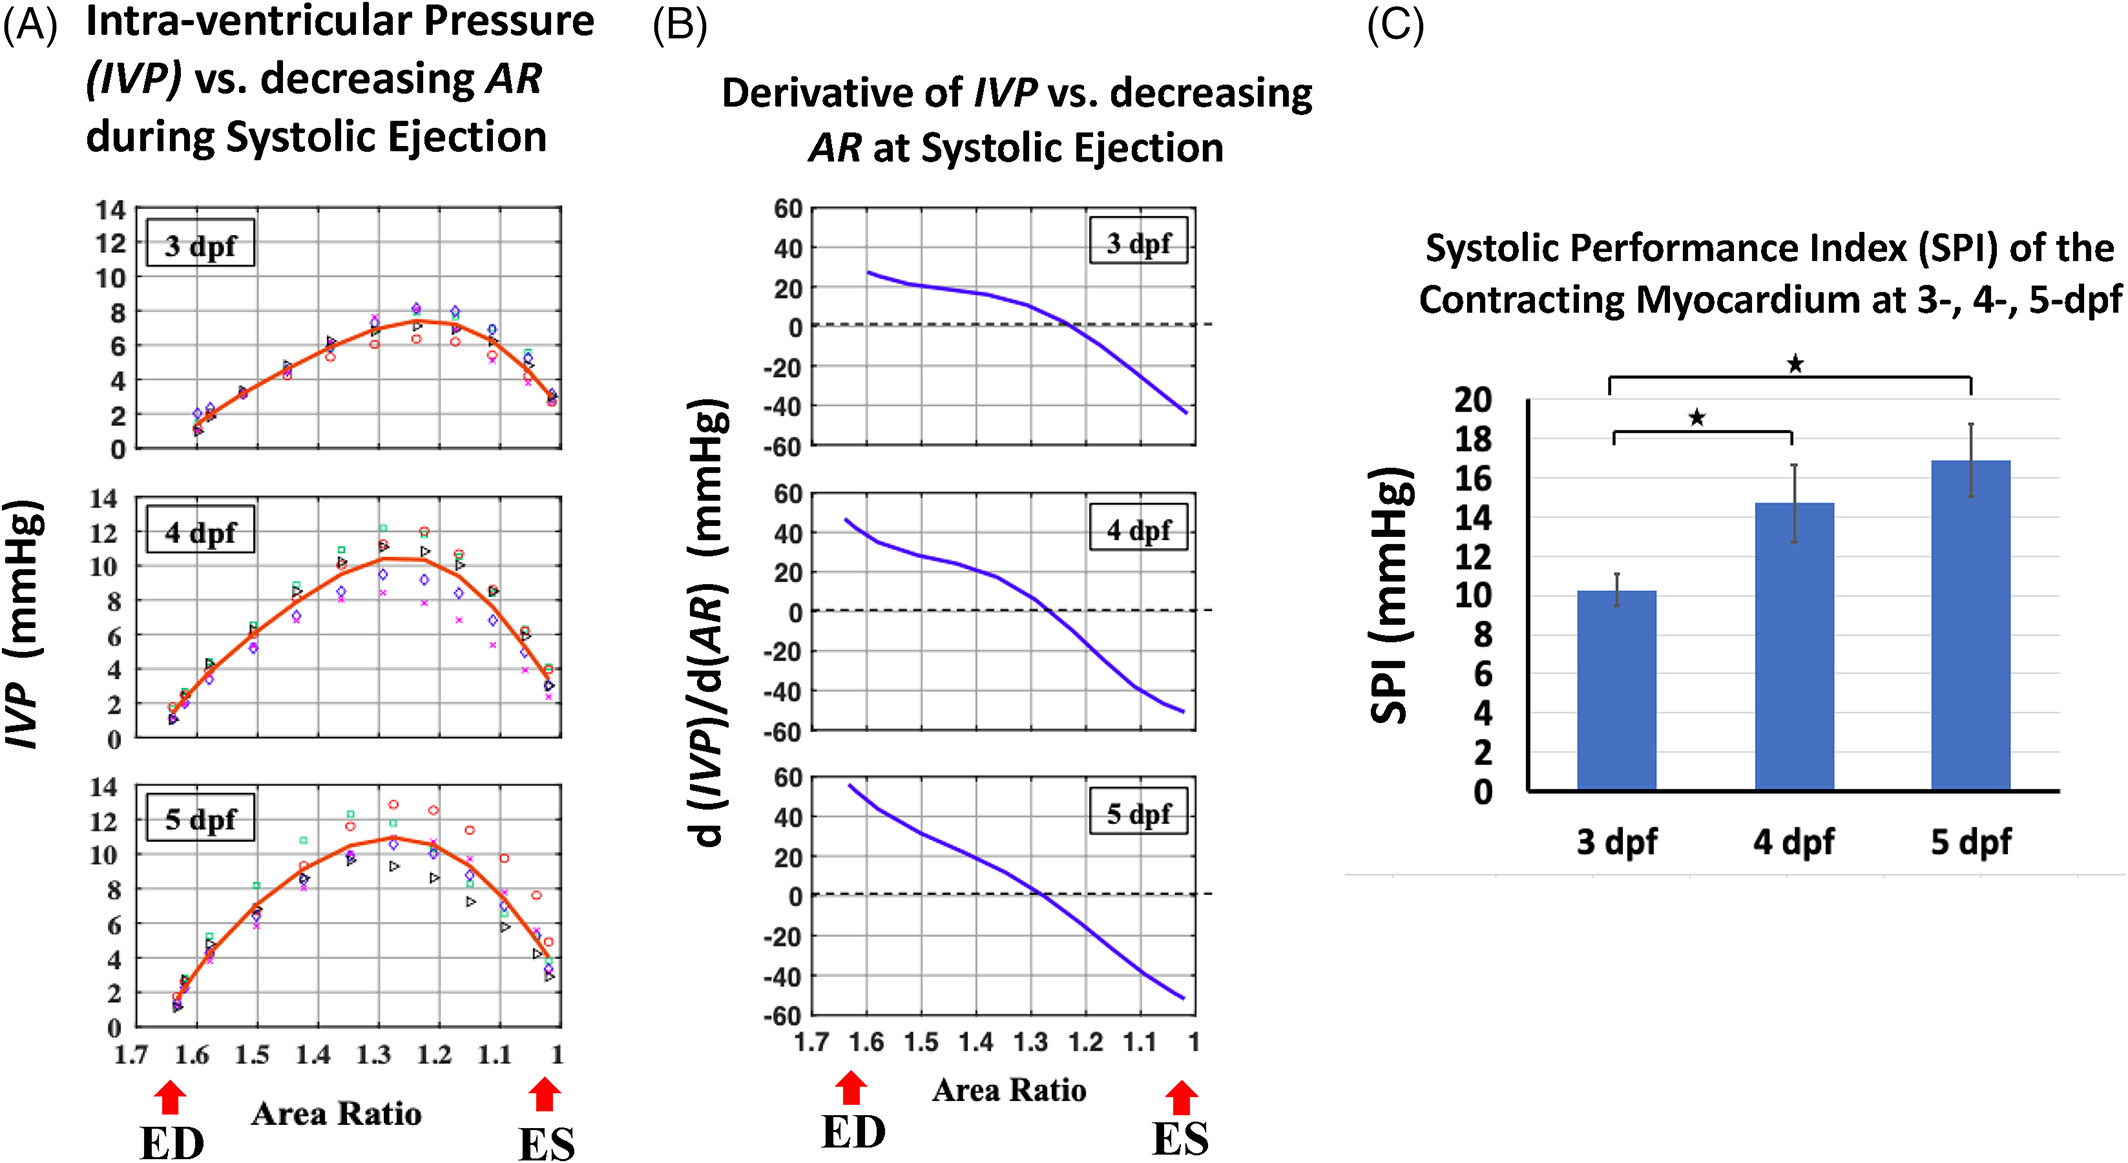
Fig. 6 Active contractile response of the ventricular. (A) Generation of intraventricular pressure (IVP) with decreasing averaged AR for each dpf during the ejection phase of a cardiac cycle. Sets of colored symbols within each dpf group represent IVP measurements from different zebrafish, and the solid red line is the fitted characteristic IVP (Table 2) for each dpf group (n = 5 in each). (B) Increasing pressure generation intensity during ejection, calculated as the derivative of the characteristic IVP with respect to AR. (C) Higher systolic performance index (SPI) of the contracting myocardium during ejection were found from 4- and 5- than 3-dpf group (P < 0.05 as denoted by asterisk)