
FIGURE
Fig. 3
- ID
- ZDB-FIG-230719-30
- Publication
- Salehin et al., 2022 - Ventricular Anisotropic Deformation and Contractile Function of the Developing Heart of Zebrafish in-vivo
- Other Figures
- All Figure Page
- Back to All Figure Page
Fig. 3
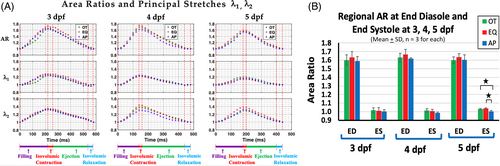
(A) Representative time courses for area ratio (AR) and principal stretches: λ1, λ2 for one cardiac cycle at the outflow (OT), equatorial (EQ), and apex (AP) regions. The four cardiac cycle phases are indicated with red vertical dashed lines. (B) Area ratio (AR) at end-diastole (ED) and end-systole (ES) during a cardiac cycle. No statistically significant differences were found among regions and in different dpf groups, except between AP vs EQ and AP vs OT in the 5-dpf group. Statistically significant differences (P < 0.05) are denoted by asterisk |
Expression Data
Expression Detail
Antibody Labeling
Phenotype Data
Phenotype Detail
Acknowledgments
This image is the copyrighted work of the attributed author or publisher, and
ZFIN has permission only to display this image to its users.
Additional permissions should be obtained from the applicable author or publisher of the image.
Full text @ Dev. Dyn.