
- Title
-
Cdkl5 mutant zebrafish shows skeletal and neuronal alterations mimicking human CDKL5 deficiency disorder
- Authors
- Varela, T., Varela, D., Martins, G., Conceição, N., Cancela, M.L.
- Source
- Full text @ Sci. Rep.

Characterization of cdkl5sa21938 mutation. (A) Localization of sa21938 mutation in zebrafish cdkl5 gene. Exons and introns are represented by boxes and solid lines, respectively. In the structure of transcripts, white and grey boxes represent untranslated regions and coding regions, respectively. cdkl5 gene (ENSDARG00000015240) and transcripts (NM_001145768 and NM_001130771) were retrieved from NCBI and Ensembl databases, respectively. Exons are in scale except exons 11 and 18. (B) Scheme of the wild-type and mutant Cdkl5 protein. PTC indicates a premature termination codon. Cdkl5 protein (NP_001124243) is available in NCBI database. |
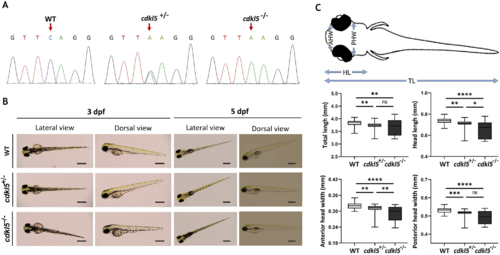
Characterization of cdkl5sa21938 mutant at initial larval stages. (A) Sequencing chromatograms showing the zebrafish genotypes for cdkl5. Arrows indicate the mutation site. (B) Representative lateral and dorsal images of wild-type (WT), heterozygous (cdkl5+/−), and homozygous (cdkl5−/−) mutant embryos with 3 dpf and 5 dpf. Scale bar = 0.5 mm. (C) Morphometric analysis of 5 dpf WT (n = 51), cdkl5+/− (n = 50) and cdkl5−/− (n = 71) embryos. Data are presented as median with interquartile range. Three independent experiments were performed. Statistical analysis was performed using Kruskal–Wallis followed by Dunn multiple comparisons test. *, **, ***, **** indicate p < 0.05, p < 0.01, p < 0.001 and p < 0.0001, respectively. ns indicates not significant. TL-total length; HL-head length; AHW-anterior head width; PHW-posterior head width. PHENOTYPE:
|
|
Morphological analysis of cdkl5sa21938 mutant at 14 dpf. (A) Representative lateral and dorsal images of wild-type (WT) and homozygous (cdkl5−/−) mutant larvae. Scale bar = 1 mm. (B) Morphometric analysis of WT (n = 30) and cdkl5−/− (n = 25) larvae. Data are presented as mean ± SD. Three independent experiments were performed. Statistical analysis was performed using t-test with Welch’s correction. **** indicate p < 0.0001. PHENOTYPE:
|
|
Craniofacial development of cdkl5sa21938 mutants with 5 dpf. (A) Representative images of the wild-type (WT), heterozygous (cdkl5+/−), and homozygous (cdkl5−/−) embryos double-stained with alcian blue and alizarin red. Scale bar = 0.3 mm. (B) Illustration of the analyzed craniofacial cartilage parameters. PHENOTYPE:
|

Skeletal development of cdkl5sa21938 mutants with 14 dpf. (A) Representative images of the wild-type (WT) and homozygous (cdkl5-/-) larvae double-stained with alcian blue and alizarin red. Scale bar = 0.5 mm. (B) Number of mineralized vertebrae in cdkl5−/− (n = 58) and WT (n = 54) larvae. Values are represented as median with interquartile range. Statistical analysis was performed using Mann–Whitney. (C) Percentage of fish with mineralized caudal fin rays. Statistical analysis was performed using the Chi-square test. **** indicate p < 0.0001. PHENOTYPE:
|
|
Behavior phenotype of mutant cdkl5 zebrafish (sa21938 line). (A) Spontaneous coiling and percentage of double coiling of wild-type (WT), heterozygous (cdkl5+/−) and homozygous (cdkl5−/−) embryos at 24-hpf. Data are presented as median ± interquartile range. (B) Total distance travelled by cdkl5+/− and cdkl5−/− mutant zebrafish embryos and WT embryos with 5 dpf, treated or not with PTZ. Data are presented as mean ± SD. (C) Percentage of time spent in the inner region of the well by 5 dpf WT, cdkl5+/− and cdkl5−/− embryos. Data are presented as median with interquartile range. Statistical analysis was performed using one-way ANOVA followed by Tukey’s test (B) and Kruskal–Wallis followed by Dunn multiple comparisons test (A and C). *, *** and **** indicate p < 0.05, p < 0.001 and p < 0.0001, respectively. ns indicates not significant. (D) Representative images of the locomotive trajectory of 5 dpf WT, cdkl5+/− and cdkl5−/− embryos. |

Molecular analysis of cdkl5sa21938 mutants. Relative gene expression analysis of neuronal markers (A), including glutamatergic neurotransmission markers (B) in wild-type (WT), heterozygous (cdkl5+/−), and homozygous (cdkl5−/−) mutant zebrafish embryos at 5 dpf, measured by qPCR. For bdnf, mecp2, gria2b and grin1b, values are presented as mean ± SD and statistical analysis was performed using one-way ANOVA followed by Tukey’s test. For mef2ca, drd2a, grim1b and slc1a1, data are presented as median with interquartile range and statistical analysis was performed using Kruskal–Wallis followed by Dunn multiple comparisons test. At least three independent experiments were performed. *, and ** indicate p < 0.05 and p < 0.01, respectively. ns indicates not significant. |