
- Title
-
Gdnf Acts as a Germ Cell-Derived Growth Factor and Regulates the Zebrafish Germ Stem Cell Niche in Autocrine- and Paracrine-Dependent Manners
- Authors
- Doretto, L.B., Butzge, A.J., Nakajima, R.T., Martinez, E.R.M., de Souza, B.M., Rodrigues, M.D.S., Rosa, I.F., Ricci, J.M.B., Tovo-Neto, A., Costa, D.F., Malafaia, G., Shao, C., Nóbrega, R.H.
- Source
- Full text @ Cells
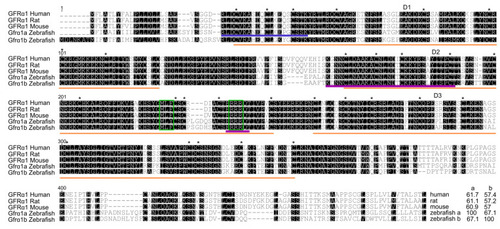
Figure 1. GFRα1 predicted amino acid sequence alignment. Numbers at the top left of the sequences indicate amino acid positions, dashes indicate deletions and black boxes indicate shared sequences. The three cysteine-rich domains (D1–D3) (orange lines), 28 cysteine residues (*) (plus 2 in the terminal region) and two triplets (MLF and RRR) (green boxes) are highly conserved among humans, rodents and zebrafish. At the end of the alignment are the percentage identity values of zebrafish Gfrα1a and Gfrα1b in relation to the other corresponding sequences. The blue line indicates the amino acid sequence recognized by the zebrafish Gfrα1a antibody used in this study; the purple line indicates the putative motifs critical for binding to GDNF.
|
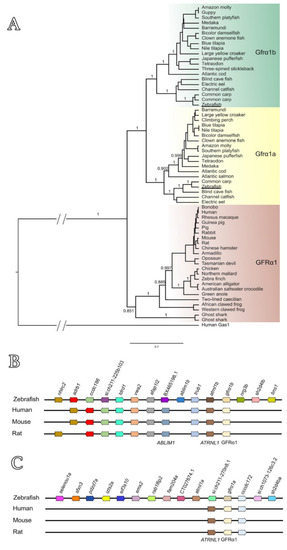
Figure 2. (A) Phylogenetic analysis of GFRα1 predicted amino acid sequences across vertebrates. Zebrafish Gfrα1a and 1b (both underlined) are clustered with other fish-specific Gfrα1a (yellow box) and Gfrα1b (green box) sequences, respectively, forming two separate subclades. Note that the GFRA1 sequences from other vertebrates (mammals, birds, reptiles, amphibians and Chondrichthyes) formed a separate clade (brown box). Branch values represent posterior probabilities obtained by Bayesian analysis (see Table S1). (B,C) Genomic organization and synteny comparisons among human GFRA1, rodents Gfrα1 and zebrafish gfrα1b (B) or zebrafish gfrα1a (C). The syntenic regions were analyzed according to the alignment of the target genes and genomic annotation available in the GenBank database (National Center for Biotechnology Information and Ensembl).
|
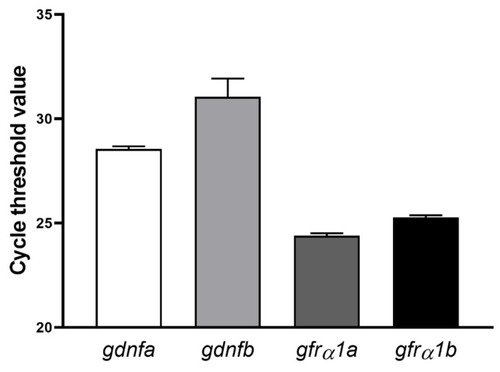
Figure 3. Number of amplification cycles (cycle threshold (Ct)) for both ligands (gdnfa and gdnfb) and receptors (grfα1a and grfα1b) in zebrafish testes. Bars represent the mean ± SEM (n = 4) for each transcript.
|
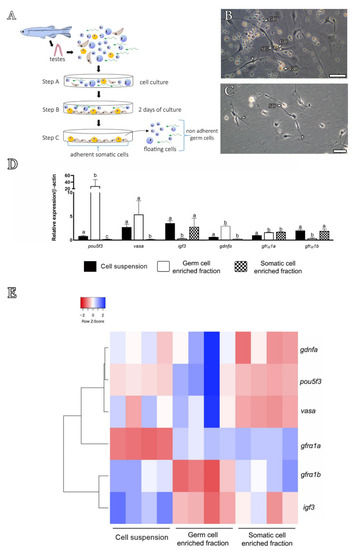
Figure 4. Differential plating method and expression analysis of the cellular enriched fractions. (A) Scheme showing the steps of the differential plating method, according to Hinfray et al. [51]. Briefly, a total testicular cell suspension was harvested (step A) in L-15 culture medium, and after 2 days of culture, only somatic cells (Sertoli cells, brown triangular shapes; Leydig cells, yellow oval shapes) adhere to the bottom of the plate (step B), while germ cells (blue shapes) remain floating or loosely attached to the bottom of the plate (step C). After washing steps, germ cells (floating and weakly attached to the somatic cells) can be removed, leaving the adherent somatic cells at the bottom of the plate. The firmly attached somatic cells can be obtained after extensive washing with trypsin. (B) Total testicular cell suspension after 2 days of culture. Note the somatic adherent cells (SCs) with cytoplasm extensions towards different germ cells (GC). (C) After washing, note that only somatic adherent cells (SCs) remain attached to the bottom of the plate. Scale bars: 20 µm. (D,E) Gene expression analysis of isolated zebrafish testicular cell populations: total cell suspension (black bar), germ cell-enriched population (white bar) and testicular somatic cells (hatched bar). Cells were obtained from three independent experiments. Bars represent relative mRNA levels of target genes expressed as mean ± SEM; different letters indicate significant differences between the cell populations (one-way ANOVA followed by the Student–Newman–Keuls test). (E) Heat map illustrating the relative mRNA levels of pou5f3, vasa, igf3 gdnfa, gfrα1a and gfrα1b according to different cell populations. Data shown are log2 values (relative quantification) relative to the average expression. Each colored cell in the heat map represents the standardized relative gene expression value for each sample. Genes (rows) are hierarchically clustered using Pearson correlation and the distance metric. The higher expression values are displayed in blue, moderate expression values in shades of white (light blue and light red) and lower expression values in red.
EXPRESSION / LABELING:
|
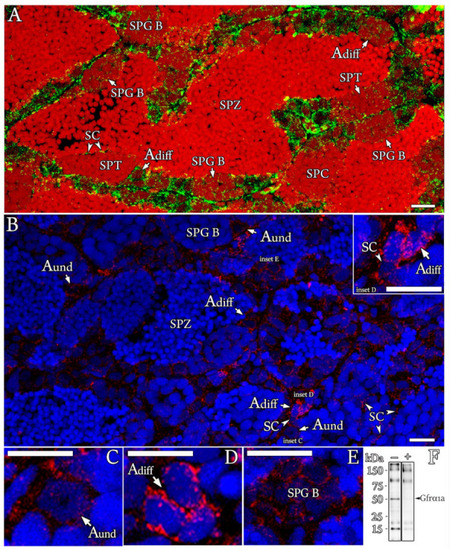
Figure 5. Cellular localization of Gfrα1a in zebrafish testis. (A–E) Immunofluorescence for Gfrα1a (green—A; red—B–E) in testis sections of sexually mature zebrafish. The spermatogonial generations, including type A undifferentiated spermatogonia (Aund), type A differentiated spermatogonia (Adiff) and type B spermatogonia (SPG B), were immunoreactive to Gfra1a, although staining patterns among them varied according to developmental stage. The signal was not found in spermatocytes (SPCs), spermatids (SPTs) and spermatozoa (SPZ). Note that Sertoli cells (SCs) contacting germ cells at different stages of development were also immunoreactive to Gfrα1a. Cell nuclei were counterstained with propidium iodide (A) or Hoechst (B–E). Scale bars: 15 µm. (F) Gfrα1a (approximately 52 kDa (kilodaltons)) immunoblots of whole testes with (+) or without (−) preadsorbed antibodies, confirming the presence of the protein in the zebrafish testes and antibody specificity.
EXPRESSION / LABELING:
|
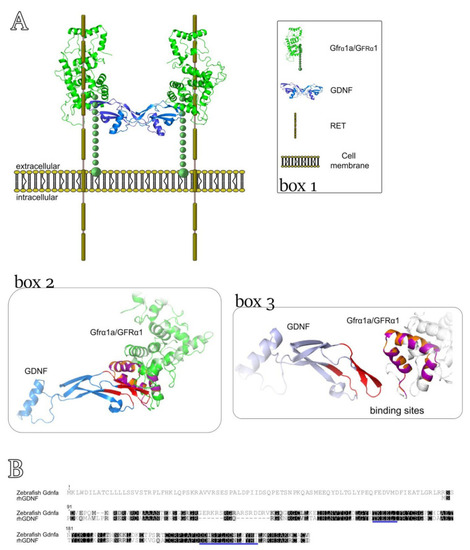
Figure 6. A 3D model to predict the interaction between rhGDNF and zebrafish Gfrα1a. (A) Box 1 depicts the molecular components of the complex GDNF-GFRα1-RET. Boxes 2 and 3 show the predictive 3D model (template 4ux8.1) in which the structural similarities between zebrafish Gfrα1a and human GFRA1 are represented by orange and purple coloring and the identity of the structure formed at the binding sites is indicated in red. In box 2, green is used to indicate the conserved amino acid sequences between zebrafish Gfrα1a and human GFRA1 and blue indicates the GNDF protein. In box 3, we highlighted the interaction sites between human GDNF and zebrafish Gfrα1a/human GFRA1. (B) Alignment of zebrafish Gdnfa with rhGDNF. The blue lines indicate the conserved binding sites to zebrafish Gfrα1a or human GFRA1.
|
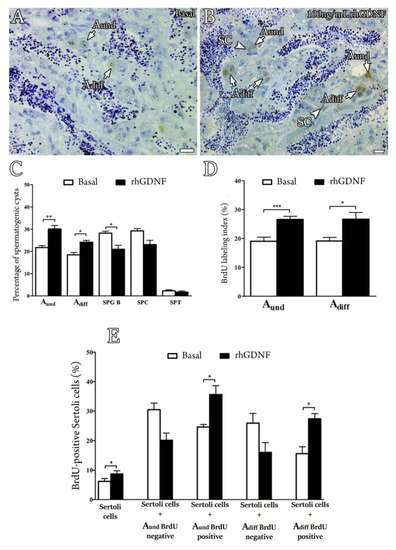
Figure 7. Effects of Gdnf on germ cell composition and cellular proliferation, using a previously established primary testis tissue culture system. (A,B) BrdU immunodetection from zebrafish testicular explants incubated for 7 days in the absence (Basal) or presence of rhGDNF (100 ng/mL), demonstrating a higher proliferation activity for type A undifferentiated spermatogonia (Aund) and type A differentiated spermatogonia (Adiff) in the presence of rhGDNF. (C) Frequency of different germ cell cysts after 7 days of incubation in the absence (Basal) or presence of rhGDNF (100 ng/mL). Types Aund, Adiff and B spermatogonia (SPG B), spermatocytes (SPCs) and spermatids (SPTs) were identified according to morphological characteristics, as described by Leal and collaborators [55]. (D) Mitotic indices of type Aund and Adiff spermatogonia after incubation in the absence (Basal) or presence of rhGDNF (100 ng/mL) for 7 days. (E) Mitotic indices of Sertoli cells in association with BrdU-negative or BrdU-positive type Aund and Adiff spermatogonia in the absence (Basal) or presence of rhGDNF (100 ng/mL) for 7 days. Sertoli cells were identified according to morphological characteristics, as described previously [55]. In fish, Sertoli cells (SCs) have a triangular nuclear shape, dark chromatin and usually they appear surrounding spermatogenic cysts, as shown in Figure S1. Bars represent the mean ± SEM (n = 10). Paired t-test, * p < 0.05, ** p < 0.01, *** p < 0.001. Scale bars: 15 µm.
|
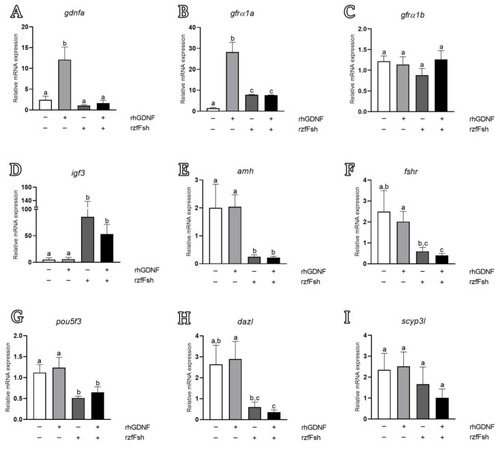
Figure 8. Relative mRNA levels of genes related to Gdnf signaling (gdnfa, gfrα1a and gfrα1b) (A–C), Sertoli cell growth factors (igf3 and amh) (D–E), Fsh signaling (fshr) (F) and germ cell markers (undifferentiated spermatogonia—pou5f3 (G); differentiated spermatogonia and preleptotene spermatocytes—dazl (H); and primary spermatocytes—scyp3l (I)). Testicular explants were cultivated for 7 days with rhGDNF, rzfFsh or both (rhGDNF + rzfFsh). The relative mRNA levels were normalized with the β-actin levels. Bars represent the mean ± SEM (n = 20). One-way ANOVA followed by the Student–Newman–Keuls test, in which different letters denote significant differences (p < 0.05) among treatment conditions.
|
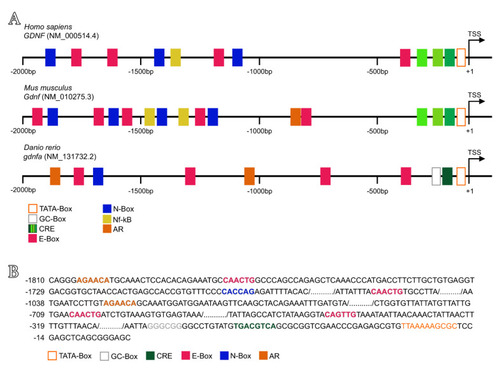
Figure 9. Predicted regulatory sequences upstream of human GDNF, mouse Gdnf and zebrafish gdnfa. (A) The upstream region (2000 bp) of human GDNF contains three different sequences of cAMP response elements (CRE), four E-box sequences, three N-box sequences and one Nf-kB binding site. The upstream region (2000 bp) of mouse Gdnf contains an N-box/E-box-rich region at bp −1300 to −1900 and additional E-boxes downstream, one androgen receptor binding site (AR), two Nf-kB binding sites and three different sequences of CRE close to the TSS (transcriptional start site). The upstream region (2000 bp) of zebrafish gdnfa contains four E-box sequences and one N-box sequence, two AR half sequences and only one CRE close to a GC-box and the TSS. TSS is the transcription start site (position +1). (B) Sequences of putative binding sites upstream of zebrafish gdnfa. In the open orange box is shown the TATA-box sequence, in the open gray box the GC-box, in the dark green box the CRE, in the pink box the E-box, in the blue box the N-box, and in the filled orange box the AR half binding site.
|
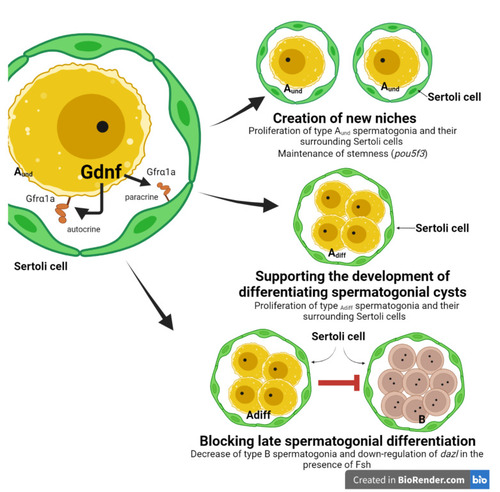
Figure 10. Summary of the effects of Gdnf in the zebrafish spermatogonial niche. Gdnf is a germ cell growth factor which acts on type A spermatogonia and their surrounding Sertoli cells in autocrine- and paracrine-dependent manners, respectively. The Gdnf receptor, named Gfrα1a, is expressed in type A spermatogonia (early spermatogonia, with higher expression in types Aund and Adiff) and Sertoli cells. The main actions of Gdnf are: (1) the creation of new available niches; (2) support of the development of early differentiating spermatogonial cysts; and (3) blocking of late spermatogonial differentiation.
|