
FIGURE
Figure 4
- ID
- ZDB-FIG-220430-70
- Publication
- Doretto et al., 2022 - Gdnf Acts as a Germ Cell-Derived Growth Factor and Regulates the Zebrafish Germ Stem Cell Niche in Autocrine- and Paracrine-Dependent Manners
- Other Figures
- All Figure Page
- Back to All Figure Page
Figure 4
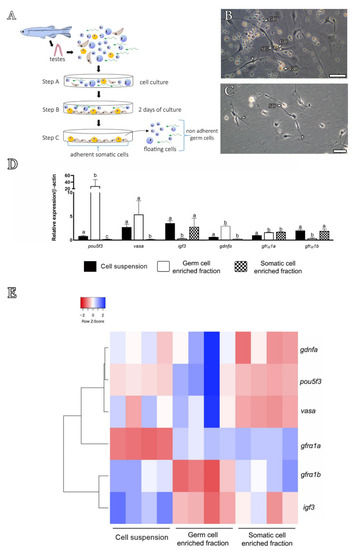
Figure 4. Differential plating method and expression analysis of the cellular enriched fractions. (A) Scheme showing the steps of the differential plating method, according to Hinfray et al. [51]. Briefly, a total testicular cell suspension was harvested (step A) in L-15 culture medium, and after 2 days of culture, only somatic cells (Sertoli cells, brown triangular shapes; Leydig cells, yellow oval shapes) adhere to the bottom of the plate (step B), while germ cells (blue shapes) remain floating or loosely attached to the bottom of the plate (step C). After washing steps, germ cells (floating and weakly attached to the somatic cells) can be removed, leaving the adherent somatic cells at the bottom of the plate. The firmly attached somatic cells can be obtained after extensive washing with trypsin. (B) Total testicular cell suspension after 2 days of culture. Note the somatic adherent cells (SCs) with cytoplasm extensions towards different germ cells (GC). (C) After washing, note that only somatic adherent cells (SCs) remain attached to the bottom of the plate. Scale bars: 20 µm. (D,E) Gene expression analysis of isolated zebrafish testicular cell populations: total cell suspension (black bar), germ cell-enriched population (white bar) and testicular somatic cells (hatched bar). Cells were obtained from three independent experiments. Bars represent relative mRNA levels of target genes expressed as mean ± SEM; different letters indicate significant differences between the cell populations (one-way ANOVA followed by the Student–Newman–Keuls test). (E) Heat map illustrating the relative mRNA levels of pou5f3, vasa, igf3 gdnfa, gfrα1a and gfrα1b according to different cell populations. Data shown are log2 values (relative quantification) relative to the average expression. Each colored cell in the heat map represents the standardized relative gene expression value for each sample. Genes (rows) are hierarchically clustered using Pearson correlation and the distance metric. The higher expression values are displayed in blue, moderate expression values in shades of white (light blue and light red) and lower expression values in red.
|
Expression Data
| Genes: | |
|---|---|
| Fish: | |
| Anatomical Terms: | |
| Stage: | Adult |
Expression Detail
Antibody Labeling
Phenotype Data
Phenotype Detail
Acknowledgments
This image is the copyrighted work of the attributed author or publisher, and
ZFIN has permission only to display this image to its users.
Additional permissions should be obtained from the applicable author or publisher of the image.
Full text @ Cells